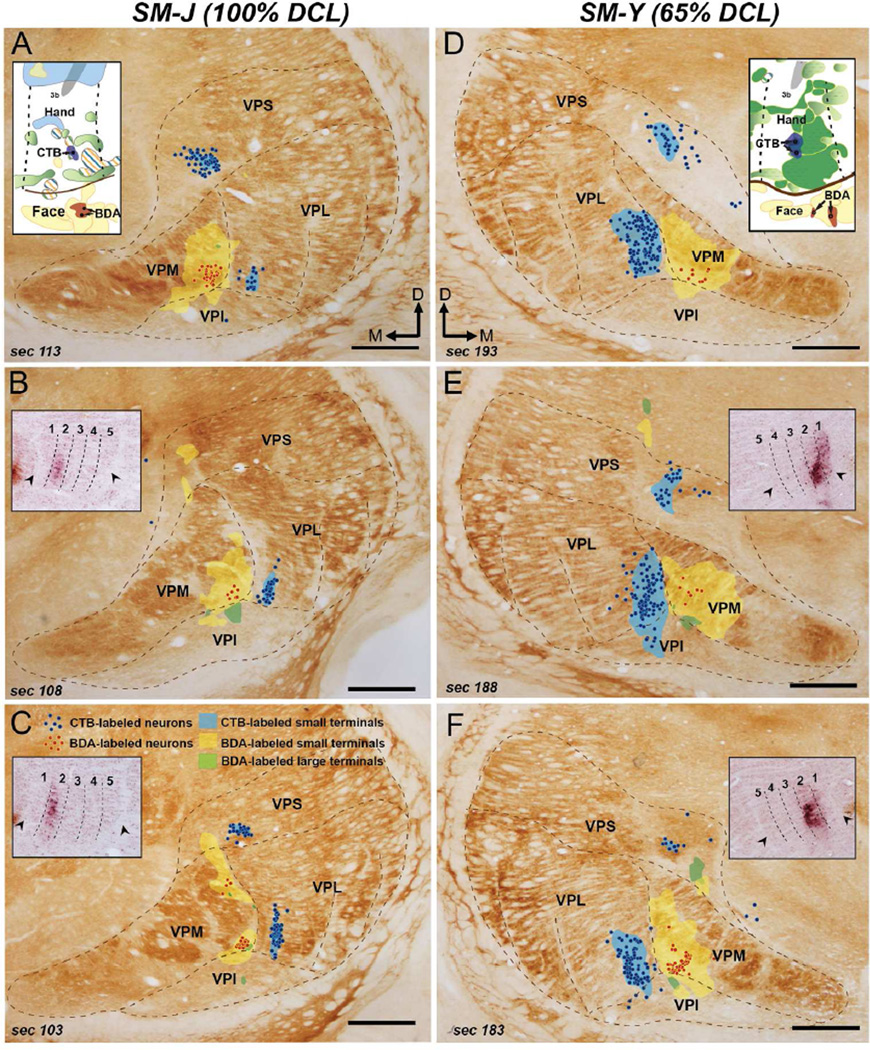
Figure 11.
Distribution of CTB- and BDA-labeled neurons and terminals in the thalamus after CTB was injected into the hand region of area 3b and BDA was injected into the face region of area 3b in monkeys SM-J (A–C) and SM-Y (D–F). Plots of label are superimposed on the adjacent CO sections that reveal the structural architecture in the thalamus. Insets in (A) and (D) show tracer injection sites in area 3b (details in Fig. 4A, C). Insets in (B), (C), (E), and (F) show photomicrographs of the CTB-labeled neurons and terminals in the ventroposterior lateral nucleus (VPL); arrowheads mark the medial-lateral extent of the hand representation in VPL, and dashed lines indicate septa that separate the representations of digits 1–5 revealed by CO staining. Note that CTB-labeled neurons (blue circles) and terminals (blue shading) are restricted to the territory of VPL, and BDA-labeled neurons (red circles) and terminals (yellow shading: small size; green shading: large size) are restricted to the territory of ventroposterior medial nucleus (VPM). Small numbers of CTB-labeled neurons and BDA-labeled terminals are distributed in the ventroposterior inferior (VPI) and ventroposterior superior (VPS) nucleus. Scale bars are 1 mm.

