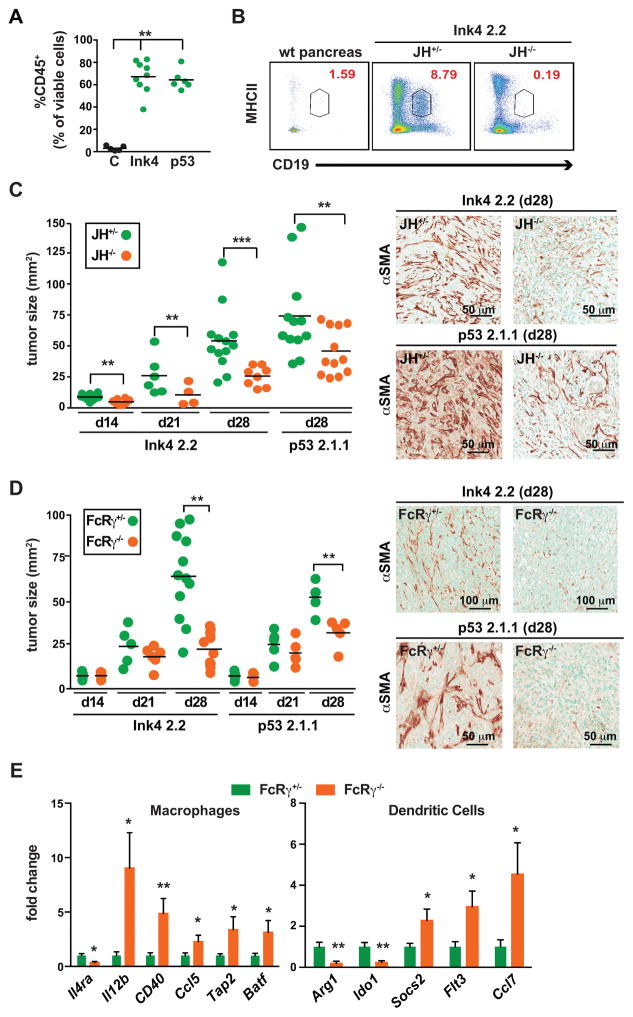
Figure 2. Orthotopic PDAC growth is regulated by B cells and FcRγ-positive myeloid cells.
A. Murine PDAC cell lines, derived from Pdx-Cre LSL-KrasG12D mice harboring an Ink4a/Arfflox/+ allele (Ink4 2.2) or a p53flox/+ allele (p53 2.1.1), were injected orthotopically into the pancreas, and subsequent tumors evaluated by FACS for CD45-positive cellular infiltrates. Graph shows percentage of CD45+ cells as a percentage of viable cells. B. Representative CD19+MHCII+ FACS plot gated on viable CD45+ cells from tumor naïve pancreas and Ink4 2.2-implanted PDAC tumors in syngeneic JH+/− and JH−/− mice evaluated 28 days after implantation. C. Ink4 2.2 and p53 2.1.1-derived PDACs were quantitatively evaluated in syngeneic JH+/− and JH−/− mice for tumor area in serial H&E-stained tissue sections reflecting tumors isolated on day 14, 21, and 28 post-implantation. On right, representative photomicrographs reflecting immuno-detection of αSMA in end-stage Ink4 2.2 and p53 2.1.1-derived orthotopic PDAC tumors. D. Ink4 2.2 and p53 2.1.1-derived PDACs were quantitatively evaluated in syngeneic FcRγ+/− and FcRγ−/− mice for tumor area in serial H&E-stained tissue sections reflecting tumors isolated on day 14, 21, and 28 post-implantation. On right, representative photomicrographs reflecting immuno-detection of αSMA in end-stage Ink4 2.2 and p53 2.1.1-derived orthotopic PDAC tumors. E. qRT-PCR analysis from cDNA reflecting FACS-purified macrophages (MØ = CD45+CD11b+MHCII+F4/80+Ly6C−) or dendritic cells (DC = CD45+CD11b+MHCII+F4/80−CD11c+) from Ink4 2.2 PDAC-derived tumors harvested from d21 FcRγ+/− (n=10) or FcRγ−/− (n=8) mice. Displayed are fold changes in genes that reached statistically significant differences. Data compiled from two independent experiments. For graphs in panels A, C–E, statistical means are shown, with p values determined by either student’s T test or one-way Anova when analyzing more than two groups, with *p < 0.05, **p < 0. 0.01, ***p < 0.001. For graphs in C and D, each data point reflects mean tumor size from one mouse based on quantitative morphometry of 5 FFPE sections, resulting from 3 independent experiments.

