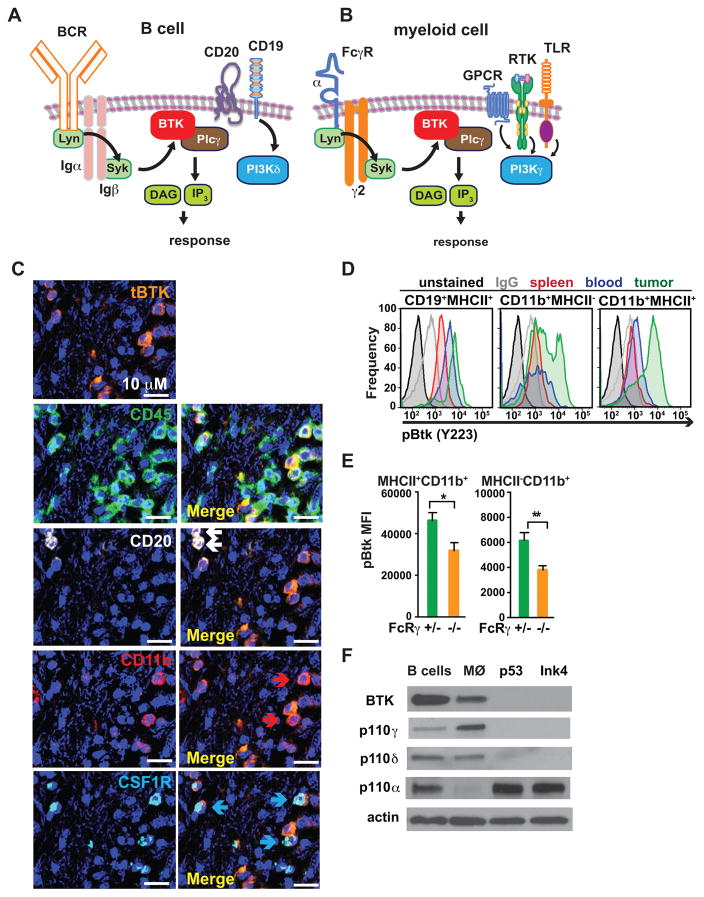
Figure 3. BTK and PI3K in PDAC-infiltrating B cells and myeloid cells.
A–B. Cartoons depicting BCR- and FcRγ-activated BTK signaling in B cells and myeloid cells. C. Representative photomicrograph showing immunodetection of BTK, CD45, CD20, CD11b and CSF1R in a human PDAC FFPE section. Arrows in ‘merged’ images indicate double-positive cells. Magnification is shown. 6 different human PDAC tumors were evaluated, and data shown is reflective of all. D. Intracellular FACS detection of activated phosphoBTK (pBTK) (Y223) in single cells harvested from peripheral blood, spleen, and tumor tissue of Ink4 2.2-implanted syngeneic mice, gated on CD19+MHCII+ B cells, CD11b+MHCII− and CD11b+MHCII+ myeloid cells. Also shown are unstained and IgG1 isotype control stained cells. Representative data from one experiment (n=7 mice) reflective of 2 independent experiments is shown. E. Intracellular FACS detection of pBTK (Y223) in MHCII+CD11b+ and MHCII−CD11b+ cells isolated from end-stage Ink4 2.2 PDAC tumors from syngeneic FcRγ+/− or FcRγ−/− mice. Data from one representative experiment (n=8 mice per experimental group) is shown and is reflective of 2 independent experiments. F. Cropped western blot images showing expression of BTK, PI3Kγ (p110γ), PI3Kδ (p110δ), PI3Kα (p110α) and actin, in murine PDAC-derived B cells, primary murine macrophages (MØ), and cultured PDAC clones p53 2.1.1 (p53) and Ink4a 2.2 (Ink4).

