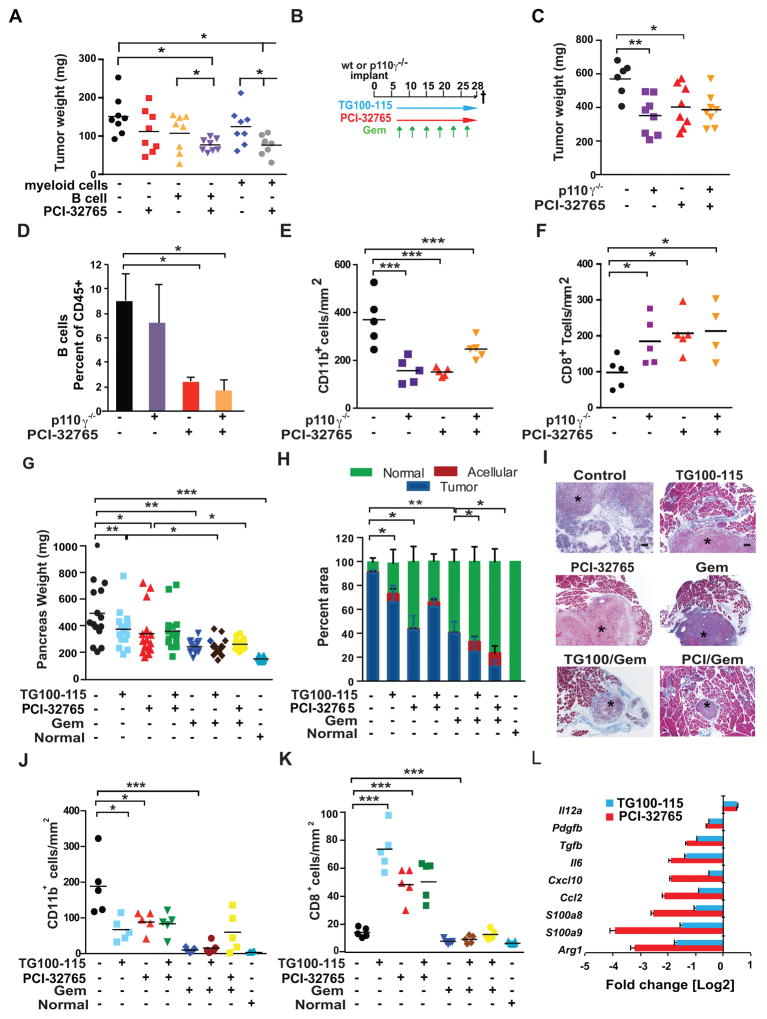
Figure 5. PI3Kγ and BTK promote PDAC progression.
A. Tumor burden in mice implanted with admixed p53 2.1.1 cells together with PCI-32765- or vehicle-pretreated B cells or myeloid cells as compared to untreated or PCI-32765 post-implantation treatment alone. B. Schemas for early treatment schedule for PDAC-bearing mice with administration of PCI-32765 in drinking water (0.016% w/v) and/or the p110γ inhibitor TG100-115 (2.5 mg/kg BID given i.p.) beginning on day 7 post-implantation, and gemcitabine (Gem; 15 mg/kg, i.v.) in p53 2.1.1 derived PDAC-bearing mice. C. End-stage p53 2.2 PDAC tumor weights from syngeneic PI3Kγ-deficient (p110γ−/−) or wildtype mice treated with or without PCI-32765 (n=10–15/mice per experimental group). D. Tumor-derived B cells as a percentage of CD45+ cells in treated tumors from ‘C’, as determined by FAC analysis. E. Number of CD11b+ cells/mm2 in treated tumors from ‘C’. F. Number of CD8+ T cells/mm2 in treated tumors from ‘C’. G. Effect of TG100-115, PCI-32765, gemcitabine (Gem) and combinations of these agents on growth to end-stage of orthotopic p53 2.2 PDAC tumors (n=10–15/mice per experimental group) depicted as total pancreas weight after 3 weeks of treatment as compared to pancreas weight of tumor-naïve mice. H. Percent residual tumor, normal acinar tissue and acellular fibrotic tissue in pancreata of tumors depicted in panel ‘G’. I. Representative photomicrographs showing Masson’s trichrome stained images of PDAC tumors (*) treated as shown reflecting quantitation in panels G and H. J. Number of CD11b+ cells/mm2 in treated tumors depicted in panel ‘C’, compared to normal pancreata. K. CD8+ T cells/mm2 in treated tumors depicted in panel ‘C’. L. Log base 2 fold change in gene expression in tumors between control and TG100-115 or control and PCI-32765 treatments (n=15). mRNAs for which TG100-115-treated tumors showed statistically significant differences from control tumors are shown. Data shown are mean +/− SEM of biological replicates and were validated in 3 or more separate experiments. Significance testing was performed by one way Anova with Tukey’s posthoc testing for multiple pairwise testing or by Student’s t test, where p>0.05 unless other specified, * P < 0.05, ** P < 0.01, and *** P < 0.001. ns indicates not statistically different. For panels A, C, E–G, J–K each data point reflects an individual tumor with statistical means shown. For mRNA expression studies, p<0.01 unless otherwise indicated.

