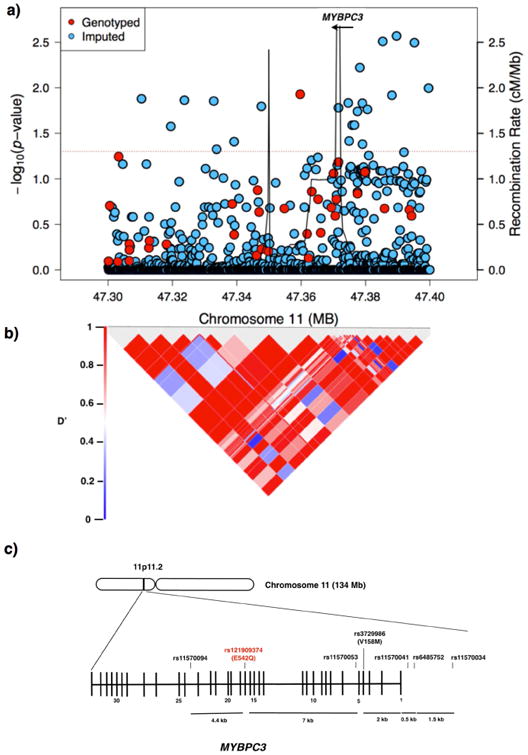
Figure 1.

Genetic variants at the MYBPC3 genetic locus. A) Regional association plot in which the red line marks a P value of < 0.05. B) Linkage disequilibrium (LD) heat map of variants in the region showing the LD (D′) between the variants with P values less than 0.05. C) Diagram of the MYPBC3 gene on chromosome (chr) 11. The location of the mutation in the index patient is in red, and single-nucleotide polymorphisms (SNPs) of the candidate gene study are in black. Vertical lines represent exons. Abbreviations: cM/Mb, centimorgans per megabase.
