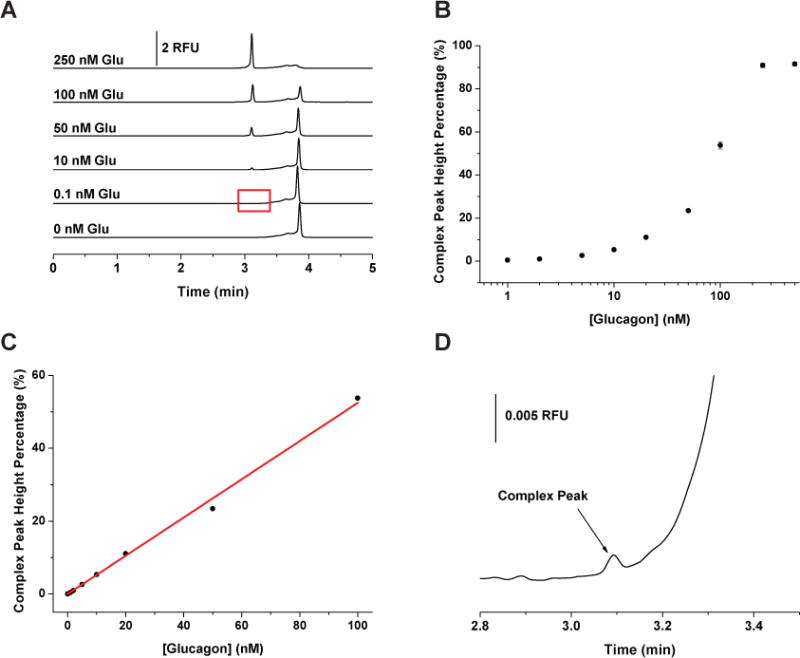
Fig. 2.

Calibration of glucagon assay. (A) Representative electropherograms when G16004 was held constant at 250 nM while the concentration of glucagon was increased from 0 to 250 nM from the bottom to the top as indicated in the figure. (B) Complex peak height percentages as a function of glucagon concentrations. (C) Calibration curve of complex peak height percentages vs. glucagon concentration from 0 to 100 nM. The data followed a linear response, Y = 0.5249 X, r2 = 0.9968. (D) Zoom in view of the G16004-glucagon complex peak for 0.1 nM glucagon. This run is highlighted by the red box in (A). All samples were incubated at 15 °C for at least 1 hour before injection. Each data point represents the mean of three runs with error bars corresponding to ± 1 SD.
