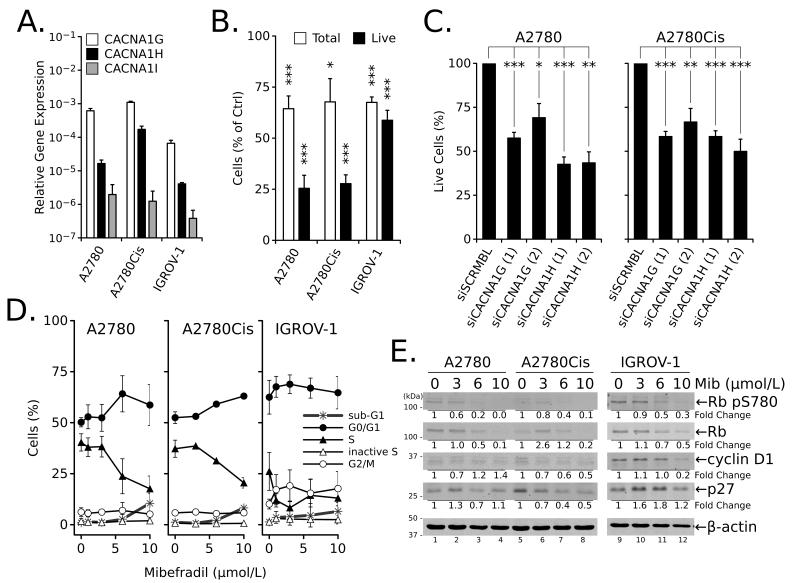
Figure 1.
Ovarian cancer cell lines express T-type Ca2+ channels and are sensitive to inhibition. (A) Expression of mRNA for Cav3.1 (CACNA1G), Cav3.2 (CACNA1H) and Cav3.3 (CACNA1I) in ovarian cancer cell lines normalized to GAPDH expression. (B) Percentage of total and viable (live, trypan blue negative) A2780, A2780Cis, and IGROV-1 cells relative to control (100%) after treatment with 10 μmol/L Mib for 24 hours. (C) Percentage of live (trypan blue negative) A2780 or A2780Cis cells after transfection with siRNA against T-type channel isoforms (two different siRNAs per gene) for 72 hours. (D) Effects of increasing concentrations of Mib on cell cycle in ovarian cancer cells treated for 24 hours. (E) Western blot analysis of cell cycle-related proteins in total cell extracts isolated from ovarian cancer cells treated with increasing concentrations of Mib for 24 hours. All values are the mean ± SEM from ≥ three independent experiments; *, P < 0.05; **, P < 0.01; ***, P < 0.001; NS, P > 0.05 relative to untreated or siSCRMBL controls.

