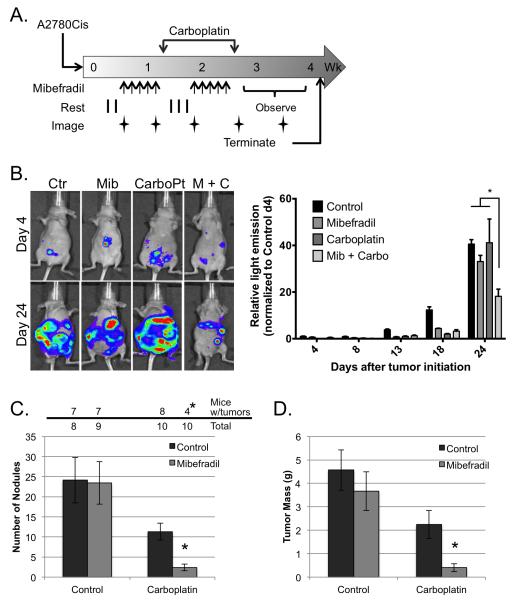
Figure 5.
Mibefradil sensitizes human ovarian cancer cells to carboplatin in a mouse model of peritoneal metastasis. (A) Schematic representation of treatment protocol. Mice were injected with 106 A2780Cis cells (day 0), treated daily with mibefradil days 4-8 and 13-17 (arrows), and twice with carboplatin one day following the last dose of mibefradil (days 9 and 18). Whole body images of light emission were obtained on days 4, 8, 13, 18 and 24. Imaging was performed prior to administration of treatment. (B) Left panel depicts representative luminescent images from individual mice in each of the 4 treatment groups taken on days 4 and 24. Total light emission was obtained from each of 4 mice per treatment arm on the indicated days after tumor initiation; values were normalized to images of control treated mice taken on day 4 (right panel). Data represent mean ± SEM; *, P < 0.05 determined by 2-way ANOVA followed by Tukey’s multiple comparisons test. (C) Tumor incidence (top panel). The number of mice with visible tumor nodules at necropsy and the total number of mice per treatment arm are indicated. *, P < 0.05 determined with Fisher’s Exact Test. Tumor nodules (bottom panel). The number of macroscopic tumor nodules was counted from each mouse upon necropsy. Data represent the mean nodule count ± SEM; *, P < 0,05, determined by 2-way ANOVA followed by Tukey’s multiple comparisons test. (D) Tumor weight. The omentum, mesentary and any visible tumor nodules were removed from each mouse and weighed. Data represent the mean tumor weight ± SEM; *, P < 0,05, determined by 2-way ANOVA followed by Tukey’s multiple comparisons test.

