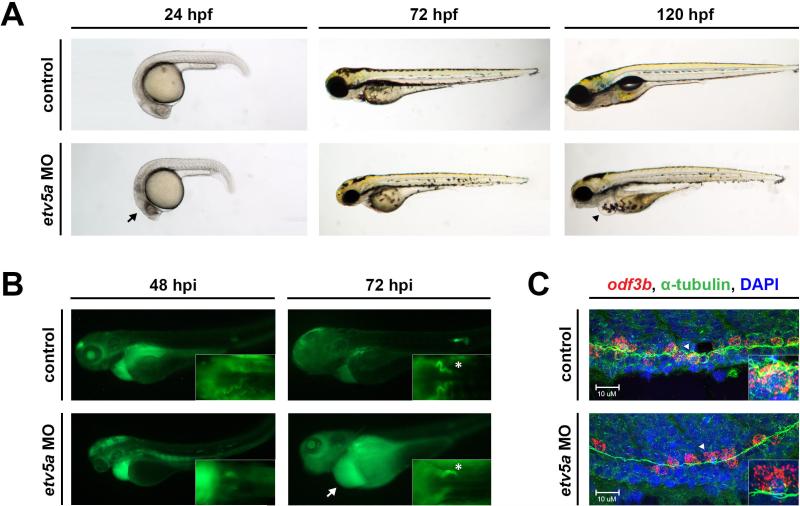
Figure 2. etv5a morphants have possible kidney dysfunction.
(A) Live time course demonstrates the formation of an edema (black arrowhead), indicative of fluid imbalance and possible renal dysfunction, by 120 hpf in etv5a morphants (etv5a MO) compared to control siblings. etv5a morphants also have a smaller, darker head (black arrow) than the control embryos. (B) Control embryos demonstrate proper renal function by clearing FITC-dextran over time. etv5a morphants continue to accumulate fluorescence (white arrow), suggesting improper renal clearance. White asterisks denote uptake of dextran by the PCT of both the control and etv5a morphant. (C) Whole mount IF in combination with FISH demonstrates that etv5a morphants have fewer odf3b+ cells (red) than control siblings at 24 hpf. Insets show digital zoom of single odf3b+ cells (white arrowhead) associated with multiple cilia (green) marked by α-tubulin in both the control and etv5a morphants. Nuclei are stained by DAPI in blue. Abbreviations: MO (morpholino), hpf (hours post fertilization), hpi (hours post injection).

