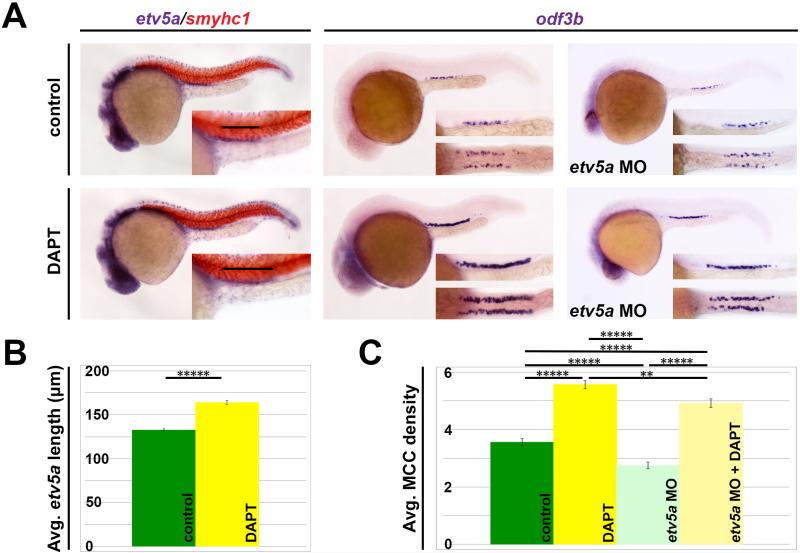
Figure 6. Notch signaling acts upstream to inhibit etv5a and restrict MCC fate.
(A) WISH staining demonstrates expanded etv5a and odf3b domains after treatment with the Notch-inhibitor DAPT. A magnified lateral view of the etv5a domain with expression denoted by the black bars can be seen in the insets. odf3b domain is shown both laterally (top) and dorsally (bottom) in the insets. (B) Quantification of etv5a expression length (μm) in the pronephros shows a significant increase in DAPT-treated embryos. (C) MCC density is significantly increased in control and etv5a morphants (etv5a MO) both treated with DAPT, however there is still a significant difference in MCC density between DAPT and etv5a MO + DAPT embryos. Error bars represent standard error. P-values: *****p<0.001; **p<0.10

