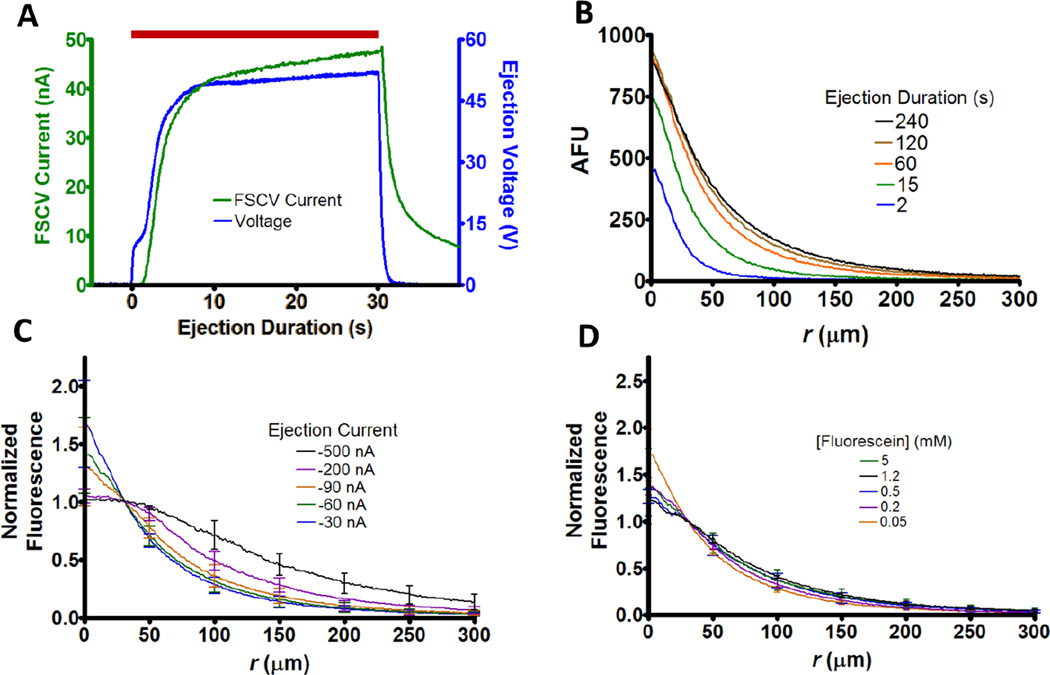
Figure 1.
Quantitative methods and spatial characterization. (A) Temporal profile for 30 nA ejection of 5 mM hydroquinone in 5 mM NaCl. The background subtracted FSCV current (green) at a carbon-fiber microelectrode and the iontophoretic pump voltage (blue) both reach steady state shortly after initiation. The red bar represents the time of the ejection. (B) Representative temporal fluorescent profiles for an ejection of 5 mM fluorescein in 0.5 mM NaCl. The ejection was performed into the cortex of a rat brain slice at −90 nA. In all cases, r=0 represents the tip of the barrel. (C) Average normalized fluorescence distribution for ejections of 5 mM fluorescein in 0.5 mM NaCl (n=6). Here and elsewhere, profiles were recorded after 4 min of continuous ejection and n represents the number of probes used to perform ejections. Unless otherwise noted error bars represent ±1 SD. (D) Average normalized fluorescence distributions for ejected fluorescein solutions at −90 nA (n=6) from a 0.5 mM NaCl solvent.

