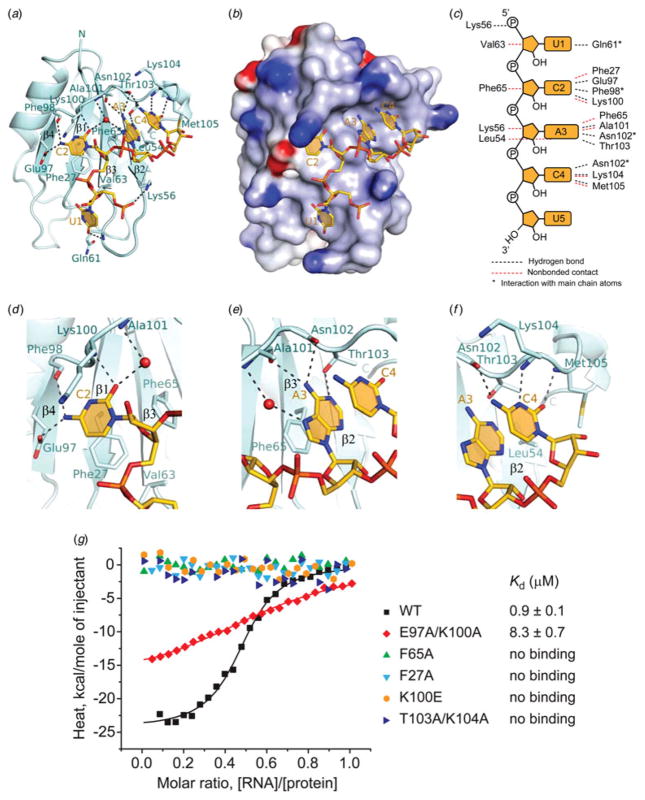
Fig. 2.
Protein-RNA intermolecular contacts in the RBPMS RRM-RNA complex. (a) Ribbon-and-stick representation of the complex containing one RRM molecule (cyan) of a homodimer bound to U1-C2-A3-C4 segment (gold) of the UCACU RNA oligonucleotide. The phosphorous, nitrogen and oxygen atoms are colored orange, blue and red, respectively. The four β-strands of the RRM β-sheet accommodating C2-A3-C4 motif are labeled. Intermolecular hydrogen bonds are shown as dashed lines. (b) An electrostatics surface view of RRM bound to U1-C2-A3-C4 (in stick representation) generated using the GRASP and PyMol programs. Basic and acidic regions of the protein appear in blue and red, with the intensity of the color being proportional to the local potential. (c) Schematic representation of protein–RNA interactions in the complex generated using the NUCPLOT software. Hydrogen-bonding and hydrophobic/stacking interactions between RNA bases and the sugar-phosphate backbone with RBPMS amino acid residues are shown by black and red dashed lines, respectively. Asterisks denote interactions involving protein main chain atoms. (d–f) Detailed view of the CAC motif recognition. (d) Hydrogen-bonding of the Watson–Crick edge of C2 with the backbone of RRM C-terminal loop and the side chain of Glu97 of β-strand β4. The base of C2 stacks with conserved Phe27 of β-strand β1 and Lys100 of the RRM C-terminal loop. (e) Hydrogen-bonding of the Watson–Crick edge of A3 with the backbone of Ala101-Asn102 and the side chain of Thr103 of the RRM C-terminal loop. The base of A3 stacks with conserved Phe65 of β-strand β3 in a parallel alignment with the C4 base. (f) Hydrogen-bonding of the Watson–Crick edge of C4 with the backbone of Asn102, Lys104 and Met105 of RRM C-terminal loop, and van der Waals interactions of C4 with the side chains of Lys104 and Met105. (g) ITC-binding curves of complex formation between the 17-nt GCACUUUCAACUUCACU ETF1 RNA target and the wild type RBPMS RRM (black squares), and the RBPMS RRM containing mutations of RNA contact residues E97A/K100A (red diamonds), F65A (green triangles), F27A (cyan reverse triangles), K100E (orange hexagons) and T103A/K104A (blue triangles). Solid lines represent nonlinear least-squares fit to the titration curve, with ΔH (binding enthalpy, kcal mol−1), Ka (association constant), and N (number of binding sites per monomer) as variable parameters. Calculated values for Kd (dissociation constant) are indicated.

