Fig. 3.
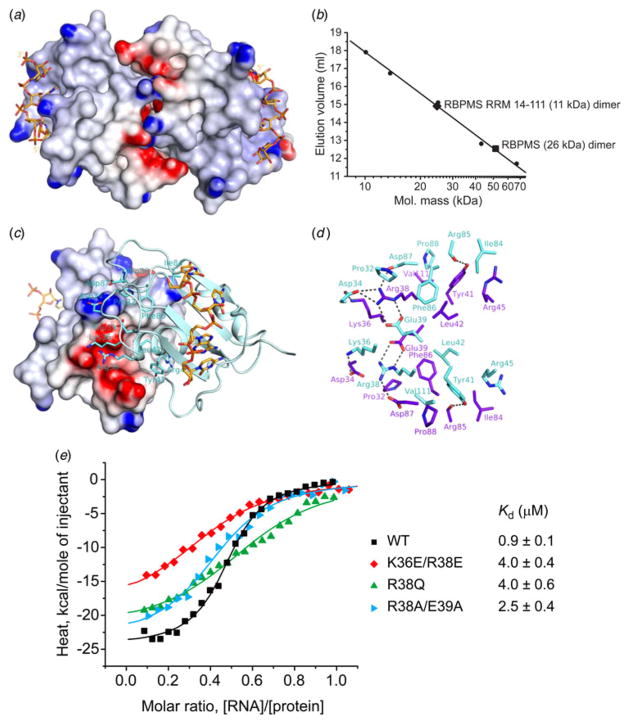
Homodimerization interface of the RBPMS RRM. (a) Electrostatic surface representation of the dimeric RBPMS RRM-RNA complex in the same view as shown in Fig. 1c, highlighting an electrostatic interaction between the basic and acidic residues along the dimer interface. (b) Gel-filtration elution volumes of the full-length RBPMS and RBPMS RRM (amino acids 11–114) plotted on the Superdex75 column calibration curve. (c) An electrostatic surface view of the dimer interface of molecule A with molecule B shown in a cyan ribbon and stick representation. Residues of molecule B involved in the dimer interface are labeled. Lys36 and Arg38 basic side chains interact with an acidic patch on the surface, and Glu39, Asp34 and Asp87 acidic side chains interact with a basic patch on the surface. (d) Details of the RBPMS homodimerization interface in the complex, highlighting interactions between residues involved in interfacial contacts. Residues of RRM molecules A and B are colored purple and cyan, respectively. The view is approximately the same in panel (c). (g) ITC-binding curves of complex formation between the 17-nt GCACUUUCAACUUCACU ETF1 RNA target and the wild type RBPMS RRM (black squares), and the RBPMS RRM containing mutations of dimerization interface residues K36E/R38E (red diamonds), R38Q (green triangles) and R38A/E39A (cyan triangles). Solid lines represent nonlinear least-squares fit to the titration curve, with ΔH (binding enthalpy, kcal mol−1), Ka (association constant), and N (number of binding sites per monomer) as variable parameters. Calculated values for Kd (dissociation constant) are indicated.

