
Figure 2.
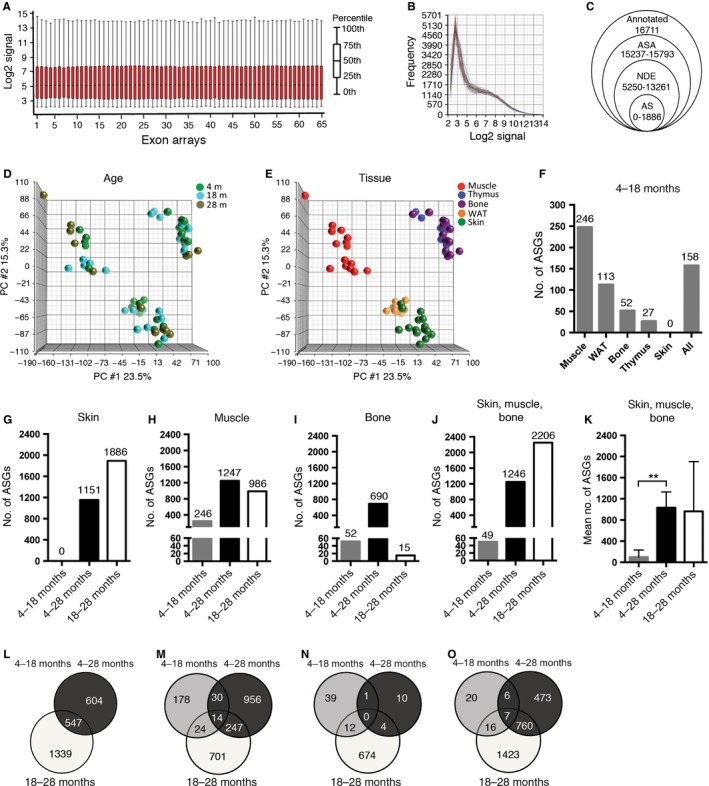
Alternative splicing analysis showed an increased number of alternatively spliced genes during aging. (A) Box‐plot overview of all probe set log2 expression values after normalization and summarization. (B) Distribution of log2 signal frequencies shows homogenous distribution across all 65 exon arrays. (C) Gene filtering for AS analysis in Partek: 194 293 probe sets were summarized in a total of 16 711 annotated genes. Fewer genes were considered by the alternative splicing analysis ANOVA, after the removal of DE genes (unadjusted age P‐value <0.05) and non‐DE genes (NDE). AS genes with FDR‐adjusted alt‐splice P‐value <0.05 were considered to be AS and were used in this study. (D–E) Principal component analysis (PCA): mapping of all 65 exon arrays grouped by age (D) and tissue (E) shows that the main variability is observed between different tissues and not according to age. (F) AS analysis between 4‐ and 18‐month‐old animals shows, with the exception of skin, a considerable number of AS genes (ASGs) in each tissue and across all tissues. (G–J) ASGs between all 3 age groups in skin (G), muscle (H), bone (I), across tissues (J) and mean number of ASGs ± SEM in the skin, muscle, and bone showed significantly more differences in ASGs between 4‐ and 28‐month‐old animals than between 4‐ and 18‐month‐old animals (K). (L–O) Venn diagrams of overlapping ASGs between different age groups in the skin (L), muscle (M), bone (N) and across skin, muscle, and bone (O) showed a considerable amount of both overlap and pairwise comparison‐specific ASGs between different age groups. WAT, white adipose tissue. **P < 0.01: two‐tailed, unpaired t‐test, the data are expressed as the means ± SEM.