
Figure 6.
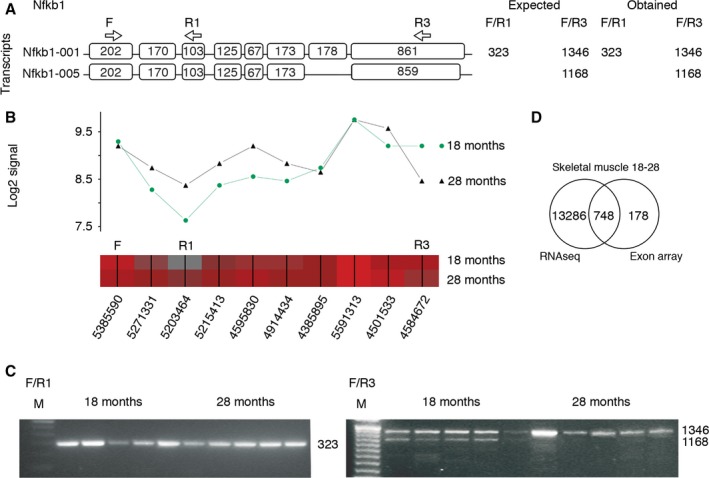
Validation of alternatively spliced genes. (A–C) Alternative splicing of the Nfkb1 gene detected by Partek's alternative splicing ANOVA at FDR‐adjusted alt‐splice P‐value <0.05 is shown as an example. (A) Transcript panel shows Ensembl references for each isoform. Exon sizes in base pair (bp), forward primer (F), reverse primer 1 (R1), R3, and primer positions (arrows) and expected and obtained amplicon sizes (in bp). (B) Overlay of the expected Nfkb1 transcript isoforms with Partek gene view containing the means of the probe set log2 signals for 18‐ (n = 5) and 28‐month‐old (n = 5) wild‐type mice (top panel) and probe set heat map with probe set IDs (lower panel, red (high) gray (low) expression). (C) RT–PCR validation shows AS in the putative region of Nfkb1. A 323‐bp product is observed in the skin of 18‐ and 28‐month‐old animals using primers F and R1 (left panel). The presence of alternative splicing in the skin of 18‐month‐old animals with two amplification products (using primers F and R3) compared to a single amplification product in the skin of 28‐month‐old animals using the same primers (right panel). M, 100 bp (Invitrogen). (D) Venn diagram of overlapping AS genes between different platforms (RNA sequencing and exon arrays) in the skeletal muscle of 18‐ and 28‐month‐old wild‐type mice, which shows a considerable overlap, validating 80.8% of the AS genes obtained by exon arrays.