
Figure 5.
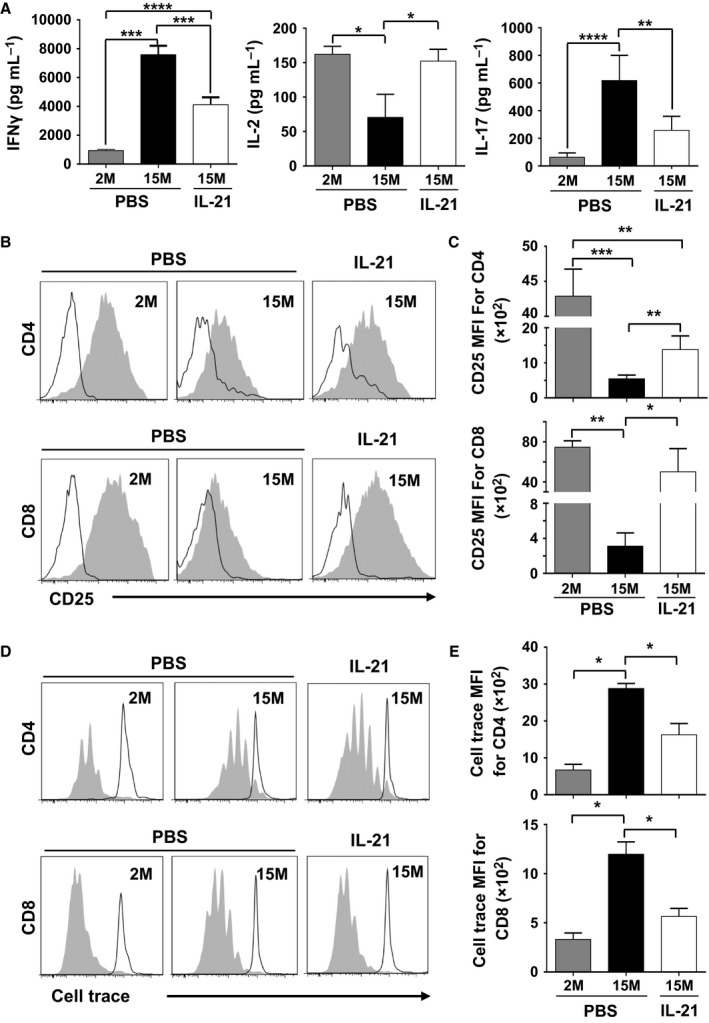
Enhanced biological responses of peripheral T‐cell pool derived from rIL‐21‐treated aged mice. (A) Cytokine quantification from stimulated CD3+ T cells isolated from the spleen of treated mice. (B) Representative flow cytometry analysis of CD25 cell surface expression on CD4+ (top panels) and CD8+ (lower panels) T cells. (C) Compiled MFIs for CD25 expression on CD4+ and CD8+ T cells. (D) Representative flow cytometry analysis of cell trace dilution following TCR stimulation of CD4+ (top panels) and CD8+ (lower panels) T cells derived from treated animals. (E) Compiled MFIs for cell trace dilution of CD4+ and CD8+ T cells following stimulation. All data are representative of three independent experiments (n = 5/group with *P < 0.05, **P < 0.01, ***P < 0.001, and ****P < 0.0001).