
Figure 6.
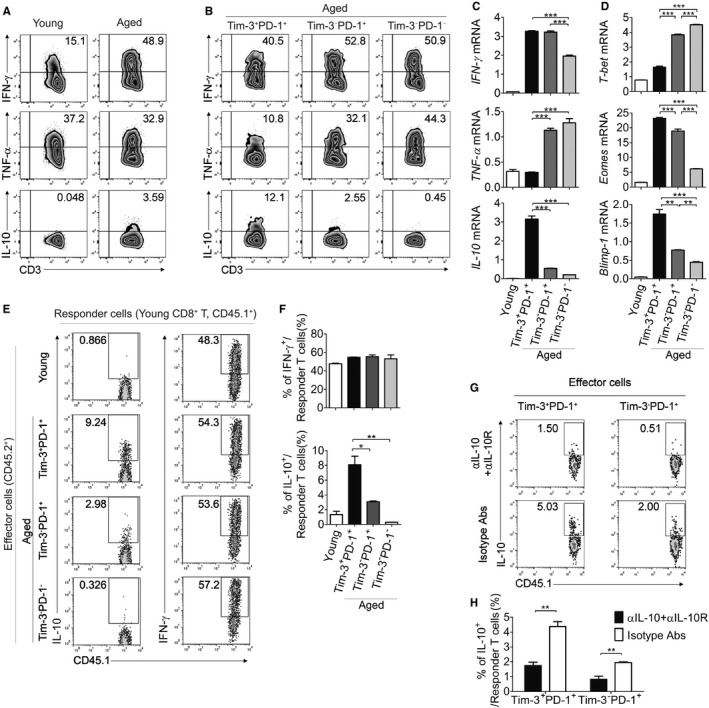
Aged Tim‐3+ PD‐1+ CD8+ T cells display partially exhausted properties with increased production of IL‐10. (A, B) Production levels of several cytokines including IFN‐γ, TNF‐α, and IL‐10 in young (n = 5) and aged (n = 5) CD8+ T cells (A) or aged CD8+ T‐cell subsets (B) after PMA/ionomycin stimulation for 3 h were analyzed by ICS. Numbers indicate the percentage of indicated cytokine‐positive cells. (C, D) The mRNA expression of IFN‐γ, TNF‐α, IL‐10, T‐bet, Eomes, and Blimp‐1 were assessed by real‐time PCR in the young (n = 5) CD8+ T cells and sorted aged (n = 5) CD8+ T‐cell subsets. (E–H) CD45.1+ CD8+ T cells were co‐cultured with young or sorted aged CD8+ T‐cell subsets (CD45.2+) with anti‐CD3 Ab plus anti‐CD28 Ab for 1 day, and ICS was performed for IFN‐γ and IL‐10 levels in the CD45.1+ CD8+ T cells after PMA/ionomycin stimulation (n = 3). Representative FACS plots are shown in (E), and statistical graphs are shown in (F). Anti‐IL‐10 Ab and anti‐IL‐10R Ab were added into the co‐culture of (E) to neutralize IL‐10; representative FACS plots and a statistical graph of the percentages of IL‐10+ cells in CD45.1+ responder cells are shown (G, H). One‐way ANOVA with Bonferroni's post hoc (C, D, F). Unpaired two‐tailed t‐test (H). Error bars represent SEM. *P < 0.05; **P < 0.01; ***P < 0.001. Data are representative of two or three independent experiments.