
Figure 4.
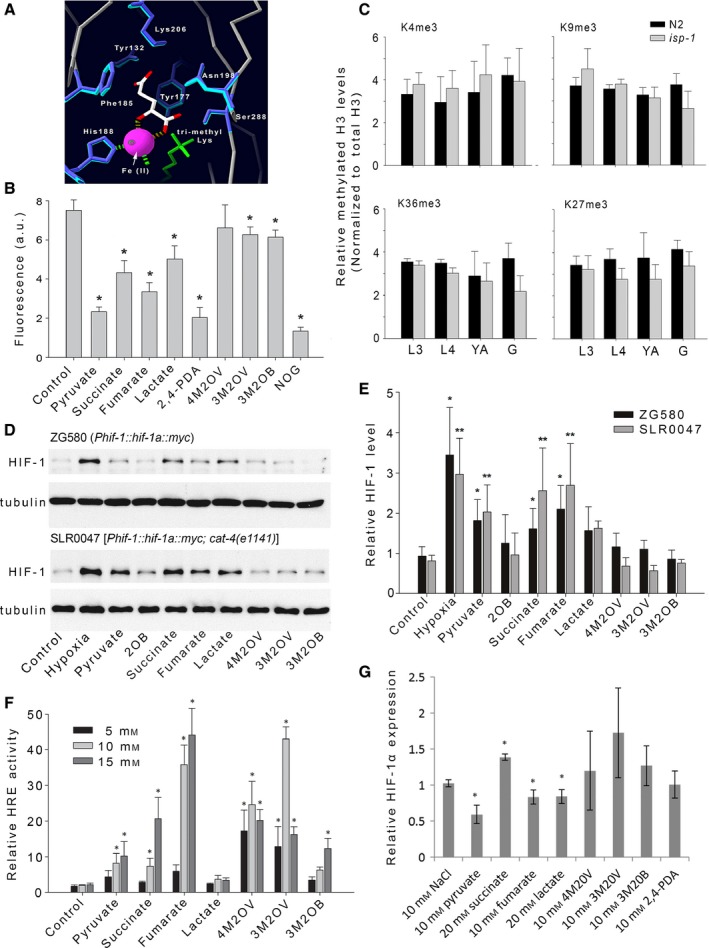
Mit mutant metabolites increase HIF‐1 levels in worms and HIF transcriptional activity in 3T3‐L1 fibroblasts. (A) Homology model of JMJD‐2. Shown is the active site of both JMJD‐2 and JMJD2A illustrating their structural conservation. Only residues within 6.2 Å of the C4 carbon of the co‐crystallized R‐2‐hydroxyglutarate inhibitor (white) are shown. Amino acid side chains in JMJD‐2 (dark blue) predicted to occupy the same topological space as active site side chains of JMJD2A (light blue) are illustrated. Ni/Fe(II)—pink ball; H3K36me3 (αα 30‐41)—green. (Numbering in panel refers to JMJD2A amino acids). (B) Recombinant JMJD2A protein was incubated with its prime substrate (H3K9me3 peptide), α‐ketoglutarate (0.5 mm) and the indicated compound (10 mm). Activity was measured by following formaldehyde production using a fluorescence assay (presented as relative absorbance units). Data is normalized to enzymatic activity in the absence of any test metabolite (control). Bars represent mean (±SEM) of duplicate independent experiments, assayed in triplicate. Asterisks indicate significantly difference with respect to control (P < 0.05, anova, Holm–Sidak post hoc analysis). 2‐oxobutyrate (2OB); 4‐methyl‐2‐oxovalerate (4M2OV); 3‐methyl‐2‐oxovalerate (3M2OV); 3‐methyl‐2‐oxobutyrate (3M2OB); N‐oxalylglycine (NOG); 2,4‐pyridinedicarboxylic acid (2,4‐PDA). (C) Comparison of histone H3 methylation levels in wild‐type (N2) animals versus isp‐1(qm150) Mit mutants. Histone H3 modifications (listed) were quantified by Western analysis. Bar plots represent mean data from three independent experiments (±1 SD). Four developmental stages were analyzed—L3 and L4 larvae, young adults (YA) and gravid adults (G). No significant differences were observed between strains (P > 0.05, anova). (D) Representative Western analysis showing acute effects of the listed compounds (40 mm each) on expression of a transgenic HIF‐1::myc reporter in otherwise wild‐type animals (ZG580) and cat‐4(e1141) mutants with enhanced cuticle permeability (SLR0047). Both untreated and positive (hypoxia‐exposed) controls are included. Test strain and genotype are indicated. (E) Quantification of all HIF‐1::myc Western analyses described in (D). Data has been normalized to untreated control worms. Bars represent mean (±1 SEM) of three independent experiments per strain. Asterisks indicate significant difference with respect to untreated control (P < 0.05, t‐test). (F) 3T3‐L1 fibroblasts containing a luciferase reporter under the control of a HIF response element (3T3‐L1‐HRE‐LucD) were treated with the indicated metabolite (at 5, 10, and 15 mm) for 20 h. Bars represent average HRE response activity from three independent experiments (error bars: ±1 SD). Data has been normalized to a NaCl‐matched control. Asterisks indicate significant difference with respect to control (P < 0.05, t‐test). (G) Quantification of HIF‐1α mRNA levels in 3T3‐L1‐HRE‐LucD cells at the end of the treatments in (F). Only the listed concentration was analyzed. Data represents average of three independent experiments (error bars: ±1 SD) and is normalized to the NaCl‐matched control. Asterisks indicate significant difference with respect to control (P < 0.05, t‐test).