Fig. 2.
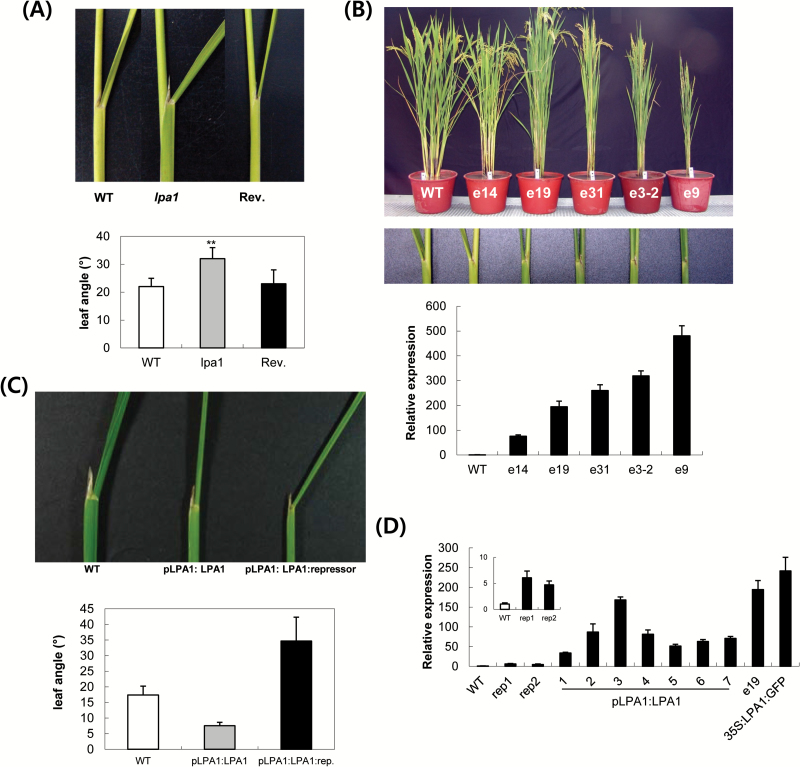
Phenotypic analysis of lpa1, LPA1 overexpressors (OX) and pLPA1:LPA1:repressor transgenic plants. (A) At the top, lamina joints of the leaves just below flag leaves at the reproductive stage are compared among WT, lpa1 and a revertant. At the bottom, measurements of lamina joint angles are shown in the diagrams. Data represent mean ±SE of more than ten plants analysed. **, P<0.001; P-value of lpa1 mutants was calculated with respect to one of WT or of revertant (B) OX lines (e14, e19, e31, e3-2 and e9) were aligned based on the expression levels of LPA1 mRNA. Lamina joint angles are shown at the reproductive stage. Using RNA from 10-day-old seedlings, qRT-PCR was employed to measure the expression levels of individual OX lines. Values were normalized against Ubiquitin cDNA from the same samples. (C) The third leaves from the reproductive stage plants are compared among Dongjin parental line (WT), pLPA1:LPA1 and pLPA1:LPA1:repressor. Since independent transgenic lines of the same constructs showed similar phenotypes of lamina bending, representative phenotypes are shown in the figure. At the bottom, measurements of lamina joint angles are shown in the diagrams. Data represent mean ±SD of more than ten plants from the lines analysed. (D) Levels of LPA1 mRNA of seven pLPA1:LPA1 (#1–7) and two pLPA1:LPA1:repressor (#1 and 2) lines measured by qRT-PCR using RNAs from 10-day-old seedlings. Values were normalized against Ubiquitin cDNA from the same samples. The transgenes were expressed under the control of the 2.4kb LPA1 promoter. (This figure is available in colour at JXB online.)

