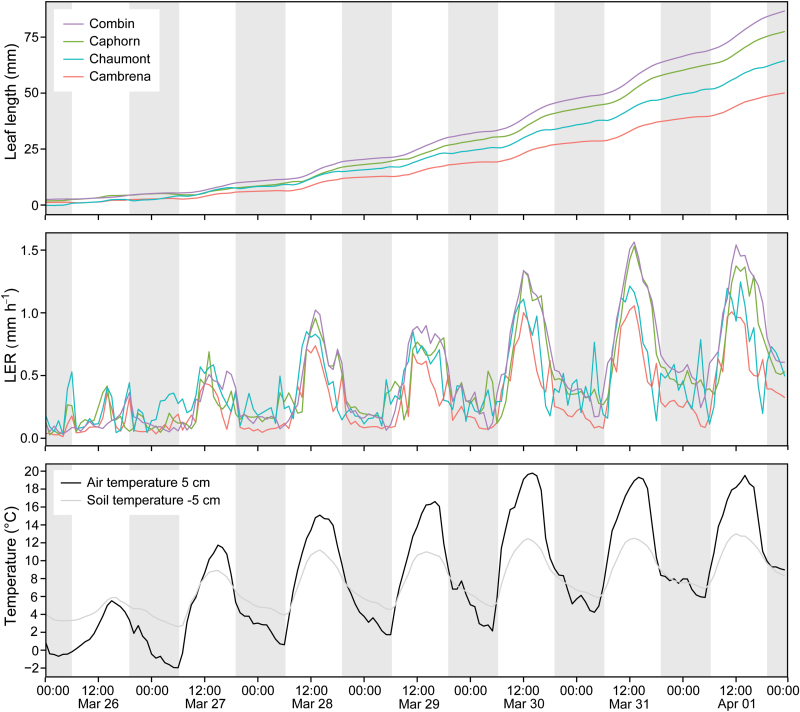
Fig. 3.
Time series of week 1 of leaf length measurements in four wheat varieties from 26th March to 2nd April 2014. Measurements were taken from leaf 7 when it first emerged until the leaves were fully developed. The upper graph is the mean cumulative leaf length of n = 20 leaves per wheat variety. The middle graph shows the corresponding mean LER. The lower graph shows the corresponding air temperature measured at 5cm above ground and the soil temperature measured 5cm below ground. Grey stripes indicate night hours.

