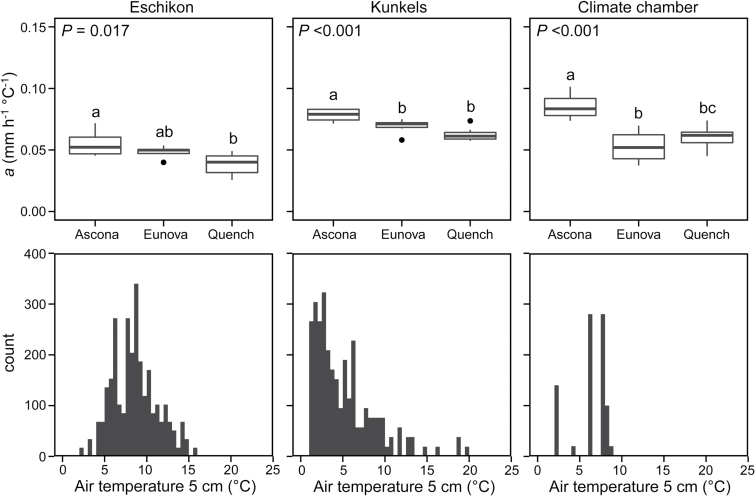
Fig. 5.
Upper row: LER per °C (a) of three summer barley varieties (each n = 7 leaves) from the two field sites and the climate chamber. P-values are derived from ANOVA and letters above boxes indicate significant genotype-specific differences (Tukey-Kramer HSD, P < 0.05). Lower row: Histograms of mean temperature per hour (in steps of 0.5°C) from the period of measurement.

