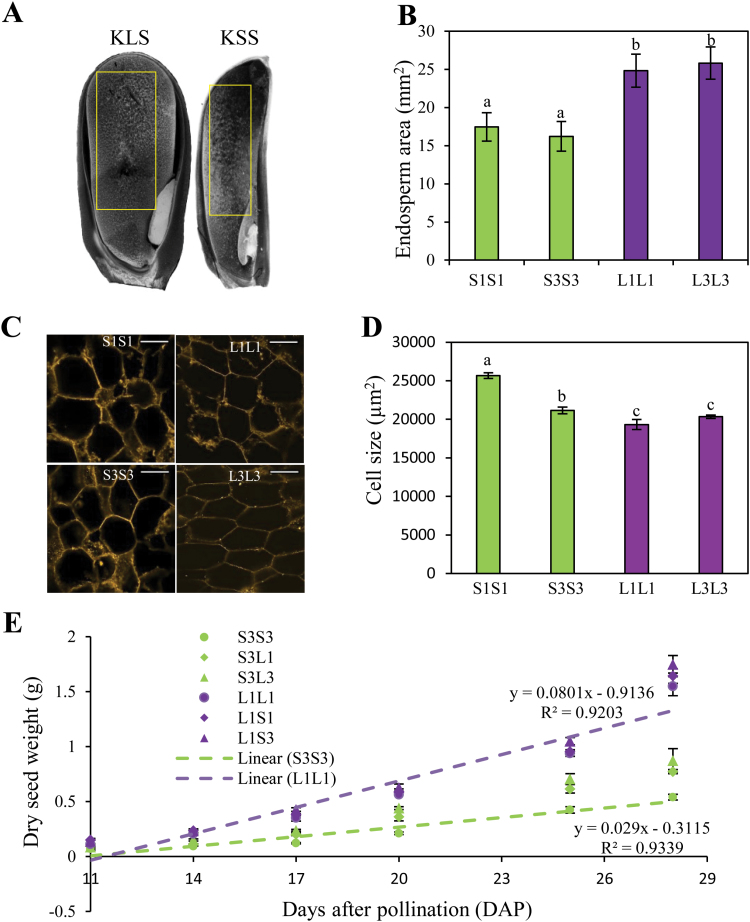
Fig. 2.
Comparison of endosperm area and cell size of KLS and KSS inbreds as well as grain filling rate in inbreds and hybrids. (A) Representative endosperms of KLS and KSS inbred lines at 17 days after pollination (DAP). Endosperm zones for measuring cell size are highlighted by the yellow rectangles. (B) Endosperm area of KLS and KSS inbreds at 17 DAP. Measurements are taken for each genotype on 33–54 developing kernels from three ears (means ±SD). Means with different letters are significantly different from each other (Tukey’s multiple pairwise comparisons test, P<0.05). (C) Endosperm cells of KLS and KSS inbred lines. Kernel sections dissected as described in the Materials and methods were stained with berberine sulfate and observed with a confocal microscope. Representative images are shown at ×20 magnification. Scale bars=100 µm. (D) Cell size in the endosperms of KLS and KSS inbreds at 17 DAP. Each data point represents 300–500 measurements (means ±SE). Different letters indicate significant differences according to ANOVA (Tukey’s test, P<0.05). (E) Grain filling rate in KLS and KSS inbreds and the corresponding hybrids. For clear demonstration, shown here is a time course of kernel dry weight collected from one KLS inbred (L1L1) and one KSS inbred (S3S3) and their crosses with two other inbred lines (S3L1/S3L3 and L1S1/L1S3). Values are the mean ±SD for n=6 replicates from three ears per date, 10 kernels per replicate. Trend line equations are shown for the inbred lines. S1S1, S3S3, L1L1, and L3L3 are inbred lines derived from KSS30 and KLS30, respectively. F1 reciprocal hybrids (e.g. S3L1) are designated with the maternal parent on the left and the paternal parent on the right.

