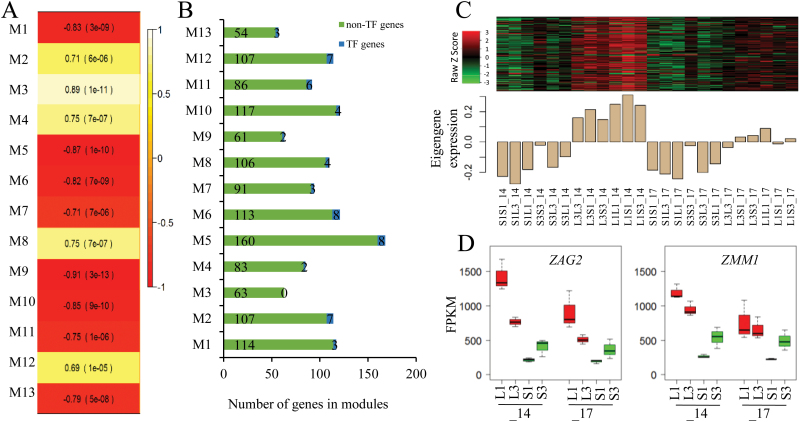
Fig. 5.
Identification of co-expression module genes associated with seed weight using the WGCNA method. (A) Module–trait relationship showing the significance of the module eigengene correlation with seed weight. Shown are correlations and P-values; cell color denotes correlation (white, positive correlation; red, negative correlation according to the color key). (B) Distribution of gene number including non-transcription factors and transcription factors among the modules that were significantly associated with seed weight. (C) Heatmap of M12 gene expression (upper panel) and expression levels of the corresponding eigengene across the samples in the M12 module (lower panel). The heatmap (upper panel) and barplot of eigengene expression (lower panel) have the same samples (x-axis). Rows of the heatmap correspond to genes, columns to samples; red in the color key denotes overexpression, green underexpression. (D) Differential expression of ZAG2 and ZMM1 in all samples grouped by maternal genotypes at 14 DAP (_14 in axis) and 17 DAP (_17 in axis). S1, S3, L1, and L3 signify the maternal parents that the samples have in common. _14 and _17 indicate samples collected at 14 DAP and 17 DAP, respectively. S1S1, S3S3, L1L1, and L3L3 are inbred lines derived from KSS30 and KLS30, respectively. F1 reciprocal hybrids (e.g. S1L1) are designated with the maternal parent on the left and the paternal parent on the right.

