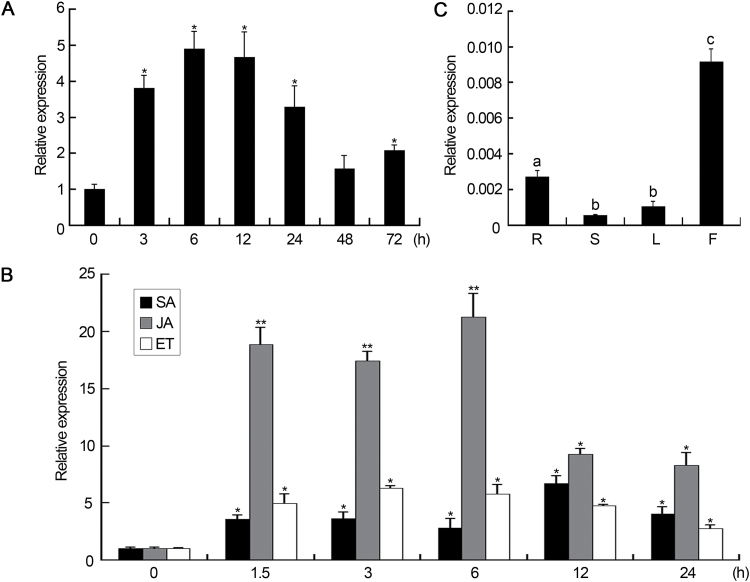
Fig. 1.
Expression pattern of the GhMYB108 gene in cotton plants. (A) Accumulation of GhMYB108 transcripts in cotton roots in response to V. dahliae infection. Error bars represent the SD of three biological replicates. Asterisks indicate statistically significant differences, as determined by Student’s t-test (*P<0.05). (B) Expression of GhMYB108 after treatments with salicylic acid, jasmonic acid, and ethylene. Asterisks indicate statistically significant differences, as determined by Student’s t-test (*P<0.05, **P<0.01). (C) qRT-PCR analysis of GhMYB108 expression in root (R), stem (S), leaf (L), and flower (F) of cotton plants. Different letters indicate statistically significant differences at P<0.05 (Student’s t-test, three biological replicates).

