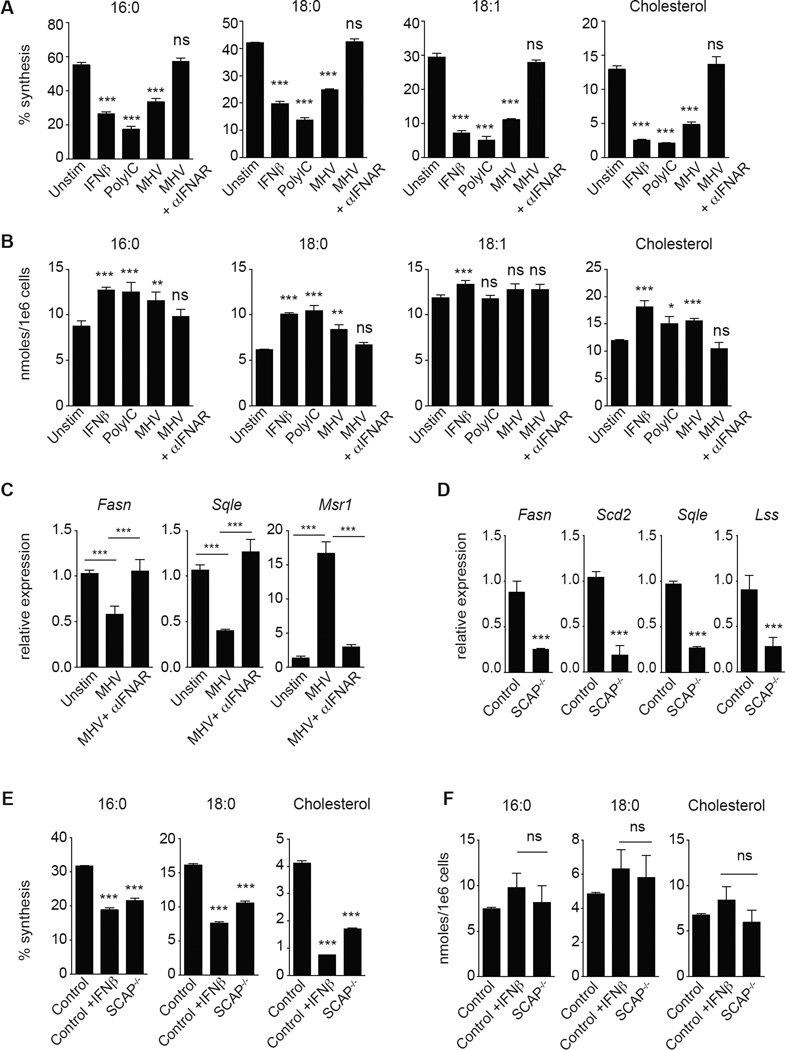
Figure 1. Type I interferon signaling shifts the balance of lipid synthesis and import.
(A) Percent synthesis of palmitic acid (16:0), stearic acid (18:0), oleic acid (18:1) and cholesterol as measured by Isotopic Spectral Analysis (ISA) on C75BL/6 BMDMs with or without interferonβ (1000U/mL IFNβ), Poly:IC (2ug/mL) or MHV-68 (MOI=0.5) +/− 10ug/mL IFNAR neutralizing antibody for 48h. (B) Total cellular palmitic acid (16:0), stearic acid (18:0), oleic acid (18:1) and cholesterol from BMDMs stimulated as in (A). (C) qPCR analysis of Fasn, Sqle, and Msr1 gene expression in BMDMs infected with MHV-68 (MOI=0.5) +/− 10ug/mL IFNAR neutralizing antibody for 48h. (D) qPCR analysis of indicated lipid synthesis genes in quiescent LysM Cre+/− control (designated Control) or LysM Cre+/− SCAPfl/fl (SCAP−/−). (E) Percent synthesis of palmitic acid (16:0), stearic acid (18:0) and cholesterol as measured by ISA of Control or SCAP−/− BMDMs unstimulated or stimulated with IFNβ as above for 24h. (F) Total cellular palmitic acid (16:0), stearic acid (18:0) and cholesterol from Control or SCAP−/− BMDMs unstimulated or stimulated with IFNβ as above for 24h. All mass spec and gene expression experiments are expressed as means ± SD from three independent experiments. *P < 0.05; **P < 0.01, ***P < 0.005 (two-tailed unpaired Student’s t test). See also Figures S1 and S2.

