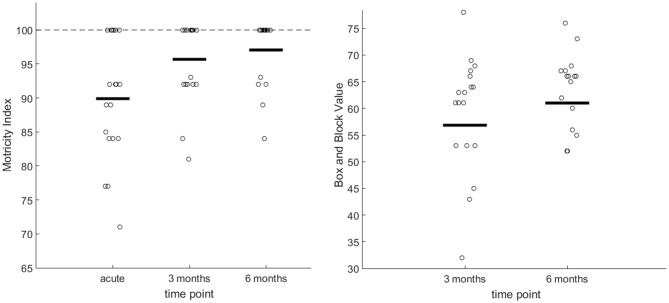
Figure 3.
Left graph: Plots of all motricity index (MI) scores for the affected hand during acute, 3 and 6 months. The bold line indicates the median. The staggered line indicates the maxima. Right graph: Plots of the box and block (BB) test for the affected hand, 3 and 6 months after stroke. The bold line indicates the median.

