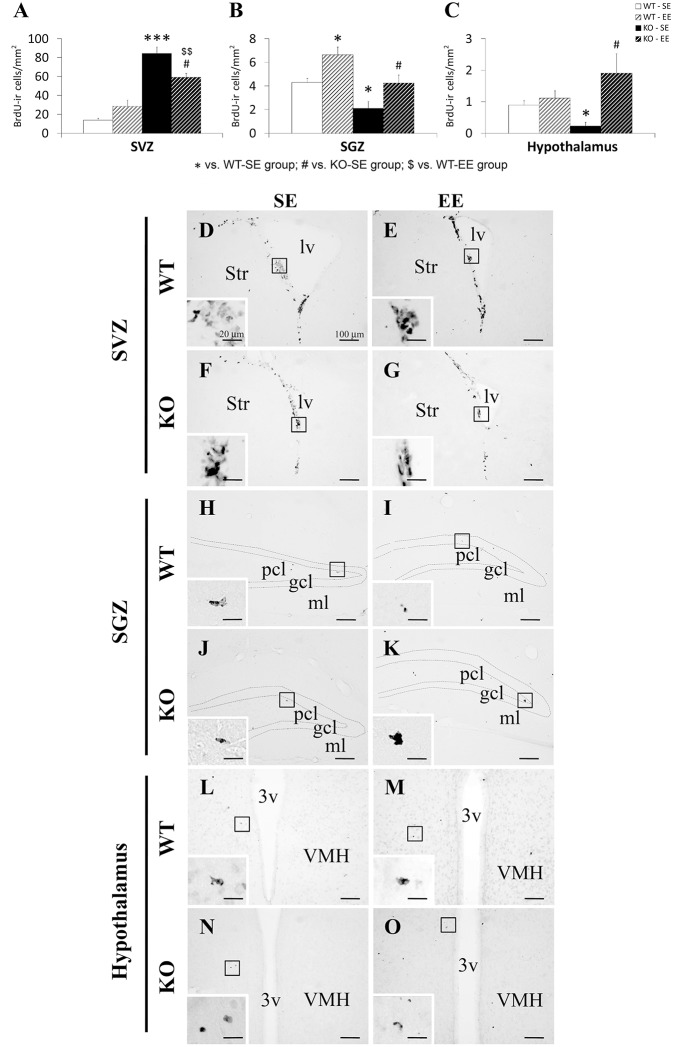
Figure 3.
Effect of environment (SE and EE) on the number of cells that contained BrdU in the SVZ (A), SGZ (B) and hypothalamus (C) of WT and Pparα−/− (KO) mice. The data were expressed as the media of the number of BrdU+ cells per area (mm2) + s.e.m (N = 5). Bonferroni's test: *P < 0.05, ***P < 0.001 vs. WT-SE group; #P < 0.05 vs. KO-SE group; $$P < 0.01 vs. WT-EE group. (D–O) Representative photomicrographs showing low and high (insets) magnification views of the typical clustering of newborn cells containing the BrdU labeling in the SGZ, SVZ and hypothalamus of WT or KO mice in a standard (SE) or enriched (EE) environment. Scale bars (100 and 20 μm for insets) are included in each image.

