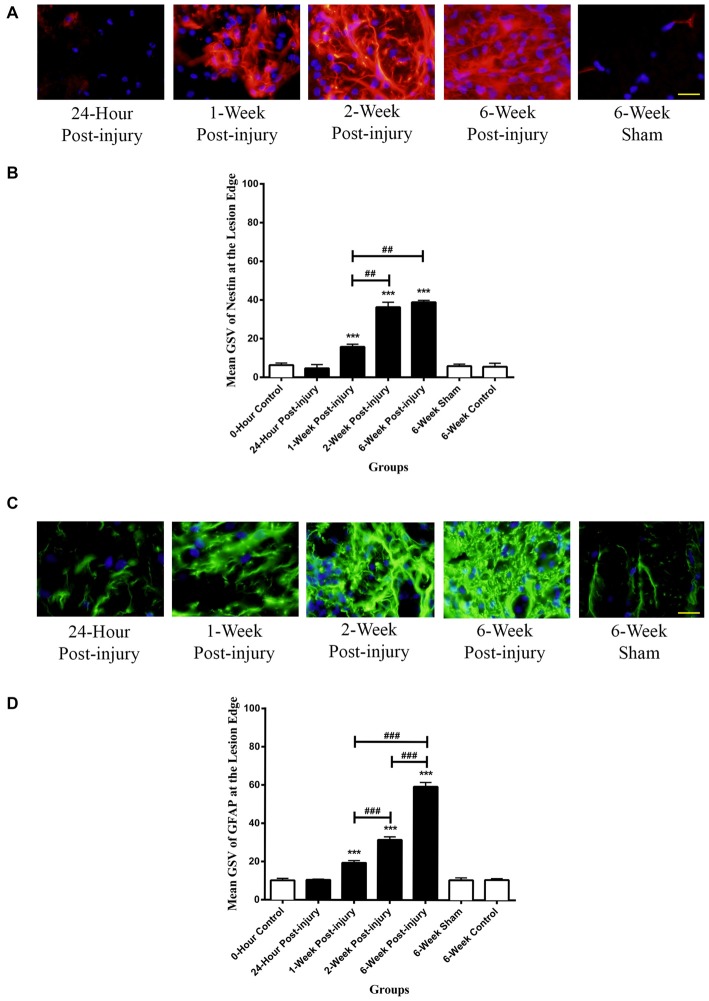
Figure 4.
Immunoreactivity of Nestin and GFAP at the lesion edge of rat spinal cord transverse sections. (A) Nestin positive cells were shown in red fluorescence, and the cell nuclei were counterstained in blue. Scale bar: 25 μm. (B) The Nestin positivity significantly elevated at 1-week post-injury and kept increasing to a maximum at 6 weeks post-injury. (C) GFAP positive cells were shown in green fluorescence, and the cell nuclei were counterstained in blue. Scale bar: 25 μm. (D) The GFAP positivity significantly elevated at 1-week post-injury and kept ascending to the maximum at 6 weeks post-injury. All data are presented as mean ± SD. Statistically significant differences were shown compared to the 6-week sham group (***p < 0.001). Statistically significant differences were revealed between groups (##p < 0.01, ###p < 0.001).

