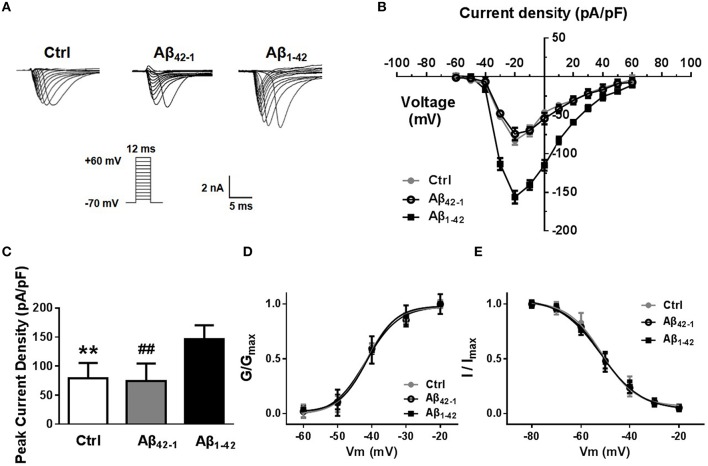
Figure 3.
Aβ1−42 up-regulates voltage-dependent sodium current. (A) Representative traces of voltage gated sodium currents recorded in response to voltage steps from −60 to +60 mV. (B) Current density-voltage relationship, illustrates that Na+ current density recorded from Aβ1−42 treatment pyramidal neurons was significantly bigger than counterparts (negative control group and reverse peptide Aβ42−−1 group, n = 12). (C) Graph, data showed peak current density recorded from Aβ1−42 treatment neurons was significantly bigger than counterparts (n = 12). (D) Normalized steady-state activation curves for Na+ currents recorded from cultured pyramidal neurons after Aβ1−42 treatment and counterparts (n = 12). The activation curves were not significantly shift after Aβ1−42 treatment. (E) Normalized steady-state inactivation curves for Na+ currents recorded from these three groups, and the inactivation curve was not significantly shift after Aβ1−42 treatment either. Mean ± SEM was displayed. **Presents p < 0.01 vs. Aβ1−42 group; ##presents p < 0.01 vs. Aβ1−42 group.

