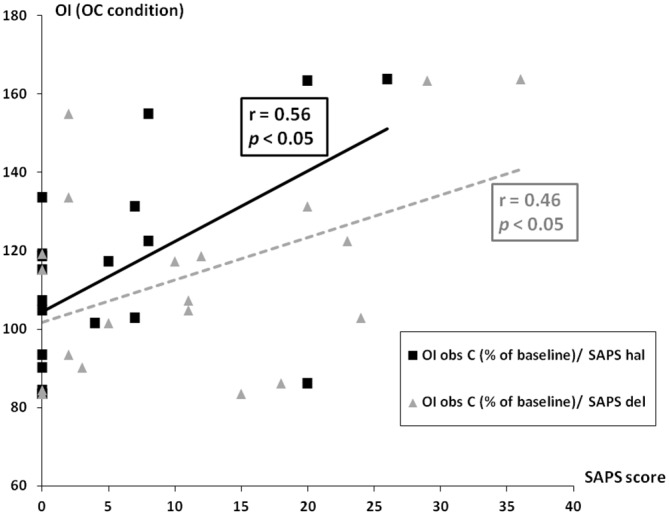
Figure 5.

Correlation between OC and scale for the assessment of positive symptoms (SAPS) global and subscales scores. On the y axis, the OI of the OC condition (observation of circles performed by an alien hand while performing lines) expressed as % of the baseline condition (UL condition). On the x axis, SAPS scores. Black squares represent comparison of Observation C with SAPS hallucinations subscale scores (SAPS hal) while gray triangles represent comparison of Observation C with SAPS delusion subscale scores (SAPS del).
