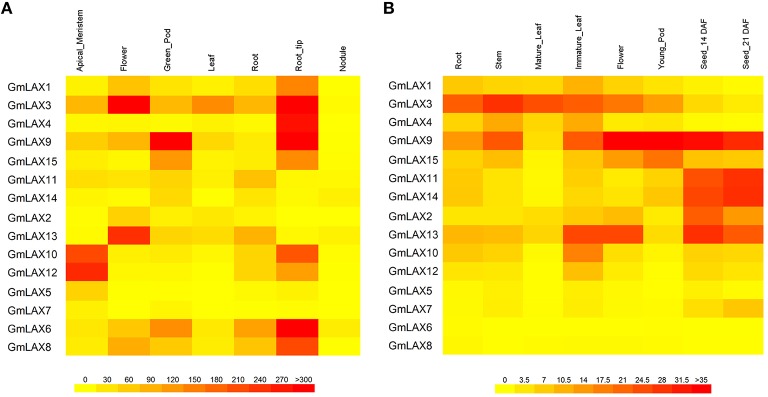
Figure 4.
Tissue/organ expression profiles of GmLAXs. (A) Expression of 15 GmLAXs in shoot apical meristem, flower, green pod, leaf, root, root tip, and nodule. RNA-Seq data (Libault et al., 2010) are shown as a heat map. (B) GmLAXs gene expression in root, stem, mature leaf, immature leaf, flower, pod, and seed at 14 and 21 days after flowering was analyzed by qRT-PCR. Relative expression values of GmLAXs were multiplied by 1000 and visualized as a heat map. All heat maps in this study were made by using the BAR Heatmapper (http://bar.utoronto.ca/ntools/cgi-bin/ntools_heatmapper.cgi).

