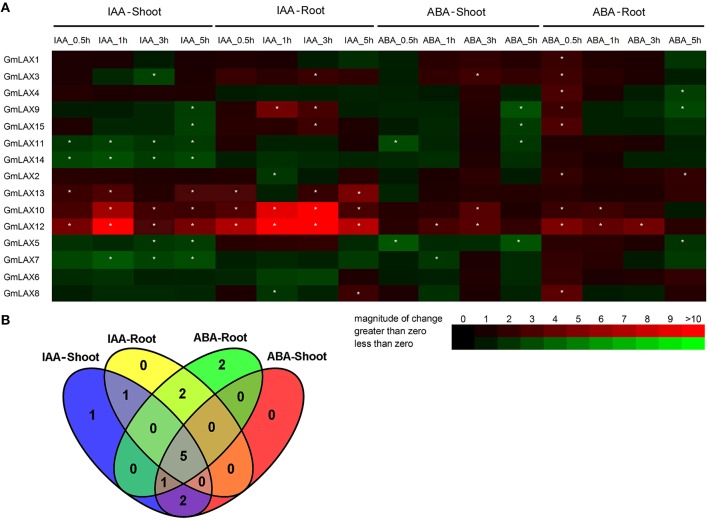
Figure 6.
Expression profiles of GmLAXs upon auxin and ABA treatments. (A) Fold changes of GmLAXs gene expression in shoots and roots under ABA (150 μM) and IAA (50 μM) treatments. Data showed the means of biological triplicates in qRT-PCR analysis. Asterisks indicated absolute fold changes (absolute value) ≥2 and P < 0.05 (Student's t-test). (B) Venn diagram analysis of data in (A). Summary of GmLAXs gene expression in shoots and roots under IAA and ABA treatments at all four time points.

