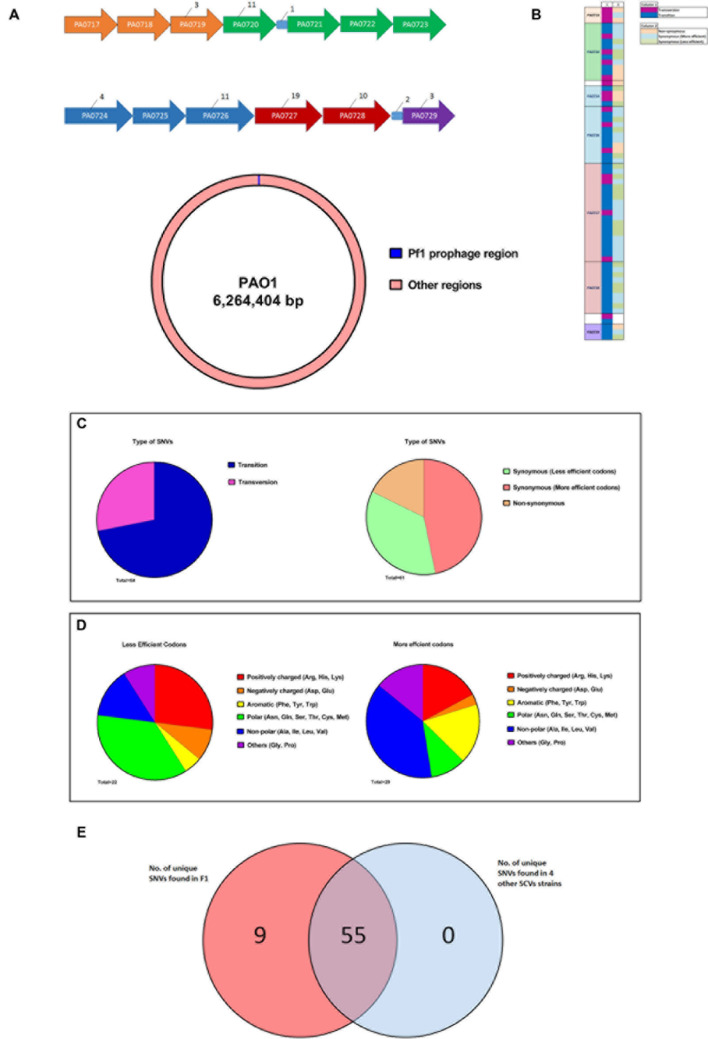
FIGURE 5.
Whole genome sequencing of F1 to identify unique SNVs. (A) Figure showing the distribution of unique F1 strains SNV across the Pf1 prophage regions. All intergenic regions except those containing SNVs were removed for clarity. Numerical values indicate the number of SNVs found in each gene. Genes of the same color belongs to the same operon. (B) A schematic showing the size of Pf1 prophage region (∼8 kb) in relation the size of the PAO1 genome (∼6 Mb) (C) Synoymous SNVs were split into two groups based on whether a less or more efficient codon for a particular amino acid was used in F1 and the type of amino acid side chains were shown in the pie charts. Aromatic and branched chain amino acids (yellow and blue regions respectively) were preferentially using a more efficient codon. (D) Diagram showing the attributes of the SNVs found in each locus. (E) Venn diagram showing the distribution of these 64 SNVs across 4 other SNV isolated from F0. 55 of these SNVs are common to all five strains.

