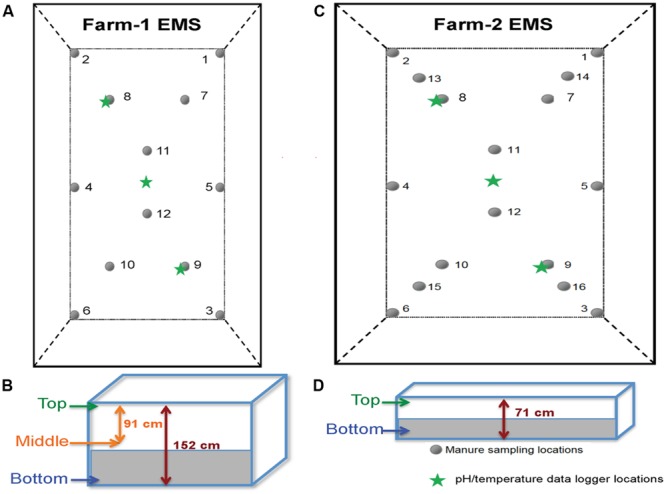
FIGURE 2.

The layout of sampled EMS in this study. (A) The layout of farm-1 EMS indicating the locations of 12 sampling points and pH/temperature data loggers. (B) Three sampling depths at farm-1 EMS. (C) The layout of farm-2 EMS indicating the locations of 16 sampling points and pH/temperature data loggers. (D) Two sampling depths at farm-2 EMS.
