FIGURE 4.

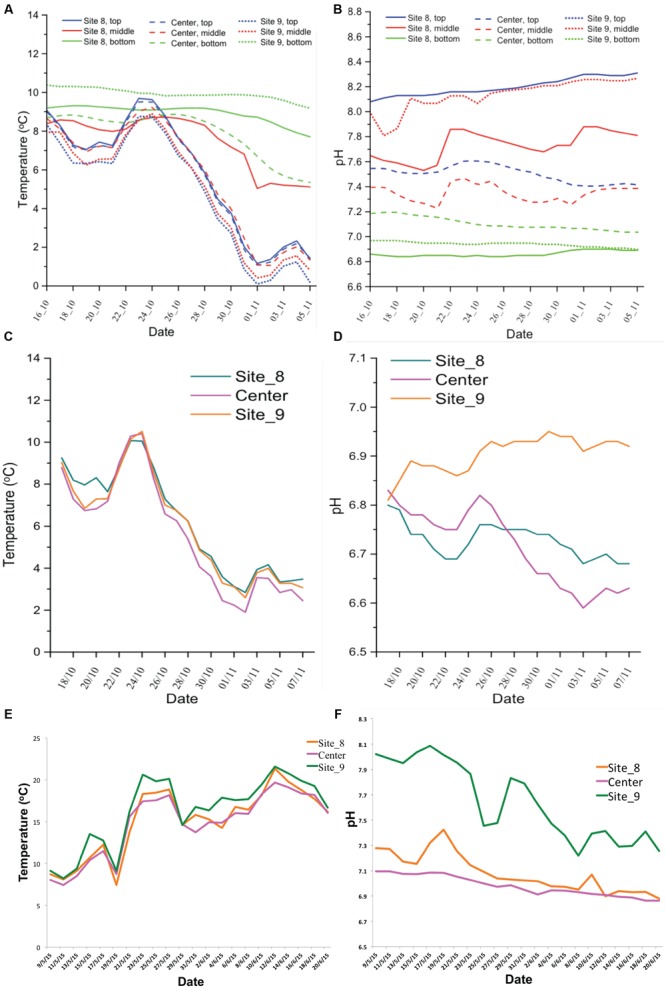
Temperature and pH dynamics in the studied EMS. The temperature and pH records for farm-1 EMS (A,B) and for farm-2 EMS (C,D) during fall sampling. The temperature and pH records for farm-2 EMS (E,F) during spring/summer sampling.

Temperature and pH dynamics in the studied EMS. The temperature and pH records for farm-1 EMS (A,B) and for farm-2 EMS (C,D) during fall sampling. The temperature and pH records for farm-2 EMS (E,F) during spring/summer sampling.