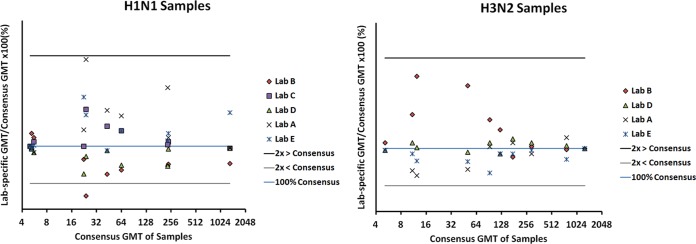
FIG 2.
Of 10 samples per virus assayed at each laboratory, the titers of all but 1 at one laboratory were within 2-fold of the corresponding consensus titers. Titers per sample, per laboratory, were expressed as a percentage of the sample's consensus titer (vertical axes) and plotted against the log2-scaled titers on the horizontal axes for the H1N1 (left panel) and H3N2 (right panel) samples.

