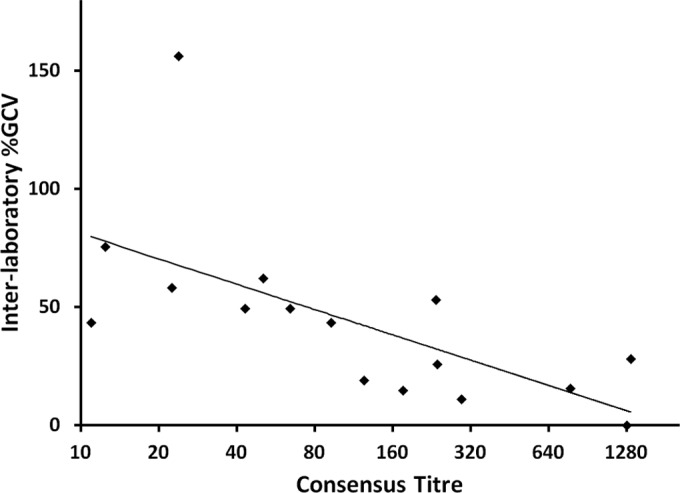
FIG 3.

Variability between laboratories in titer estimations (expressed as GCV on the y axis) tends to be higher for samples in low measurement ranges and to decrease as the measurement range increases; n = 16 (4 samples that were below the lower limit of titer quantitation were excluded).
