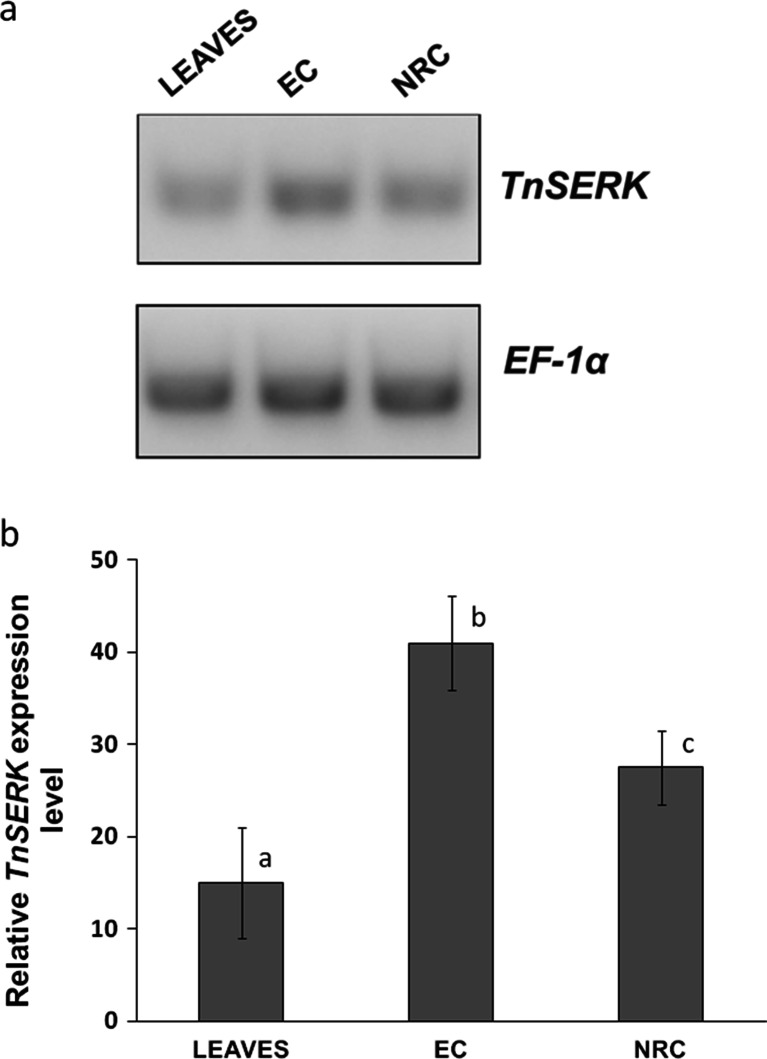
Fig. 2.
Semi-quantitative RT-PCR analysis of TnSERK expression in different tissues. a Gel image of RT-PCR products obtained with SERK and EF-1α gene-specific primers. b Relative expression of TnSERK gene after densitometric analysis. Accumulation of EF-1α was used as an internal control and acknowledged as 100 % in each sample type. Treatments bearing different letters differ significantly (p ≤ 0.05) by Tukey’s multiple range test. Total RNA was extracted from embryogenic callus with somatic embryos (EC), non-regenerative callus (NRC) and leaves

