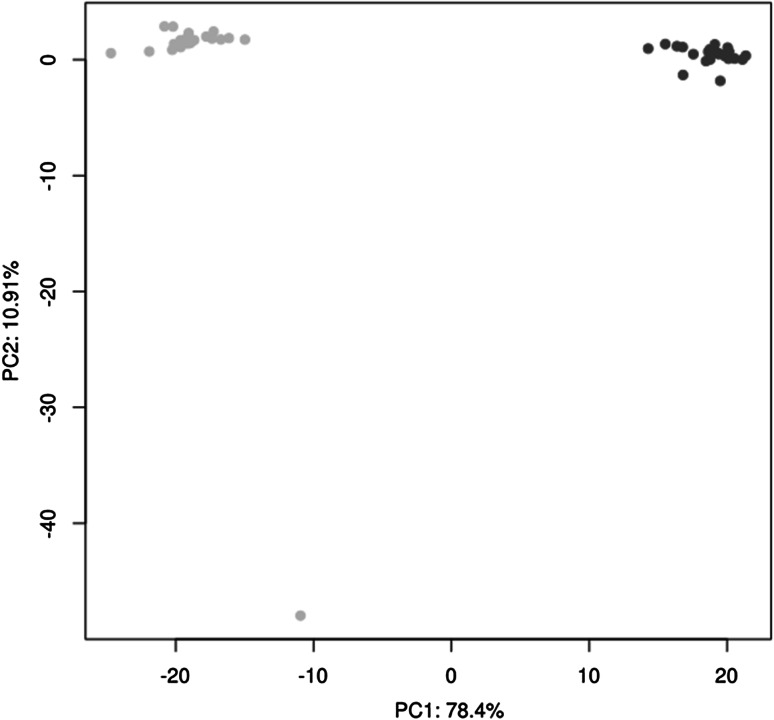
Fig. 2.
Principal component analysis (PCA) plots of Planktonic (blue) and biofilm (red) metabolomic data sets, utilising a 10 min bead beating extraction method; beads in a 50:50 suspension in extraction solvent of chloroform; methanol; water (ratio 1:3:1), followed by liquid-chromatography-mass spectrometry. Red and blue data plots represent planktonic cells and biofilm biological sample replicates, respectively. n = 24 (Color figure online)

