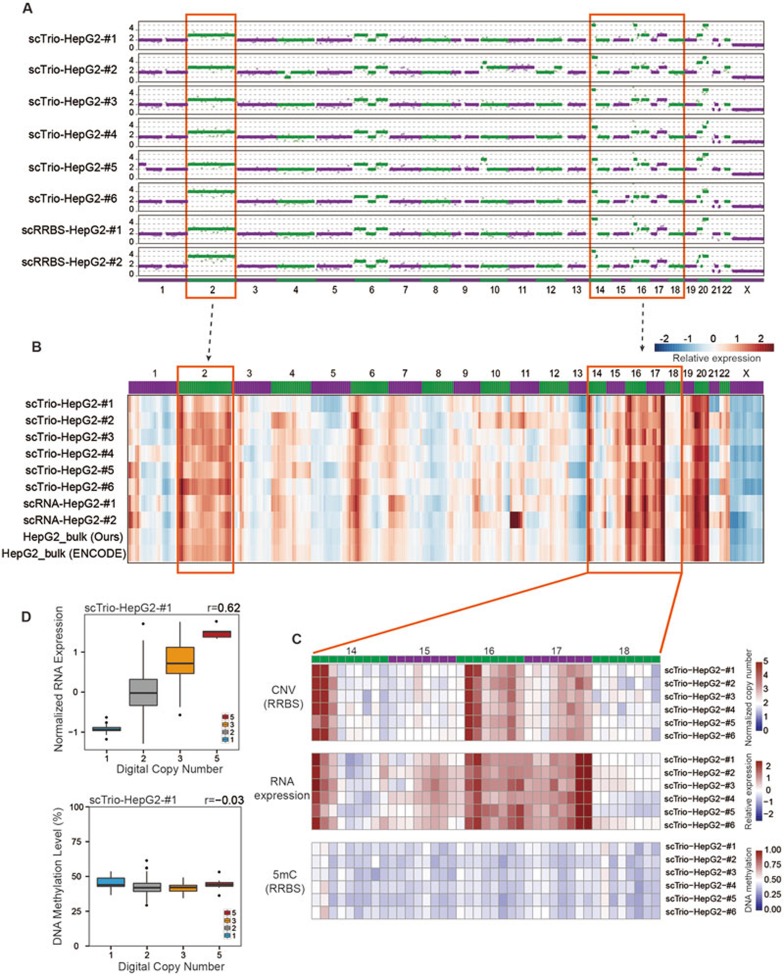
Figure 3.
The relationships between genome (CNVs), DNA methylation, and gene expression in single cells. (A) CNV deductions of single HepG2 Trio-seq data or scRRBS data at a 10-Mb resolution. The purple or green dots represent the normalized copy numbers and the purple or green segments represent the integer copy number fitted by HMM. (B) Heat map of normalized relative gene expression levels in 10-Mb genomic windows. The genes are ranked according to their genomic positions. The relative expression values (normalized to liver bulk RNA-seq data) of all the genes in each 10-Mb window of each sample are represented by blue to red colors. (C) Relationship between CNV patterns, DNA methylation, and gene expression within single cells. Normalized DNA methylation value is compared with bulk liver RRBS data. Zoom-in pictures represent the normalized copy number, relative RNA expression, and DNA methylation values of the same 10-Mb window from the regions from Chr.14 to Chr.18. (D) The correlations between the copy numbers and gene expression (or DNA methylation levels). The boxplot shows the distributions of each 10-Mb window's relative expression level (or DNA methylation level) within each copy-number group. The Pearson correlation coefficient is shown at the top right corner. Note that there is no 10-Mb DNA fragments with digital copy number of 4.

