. 2016 Feb 29;59(2):106–116. doi: 10.3340/jkns.2016.59.2.106

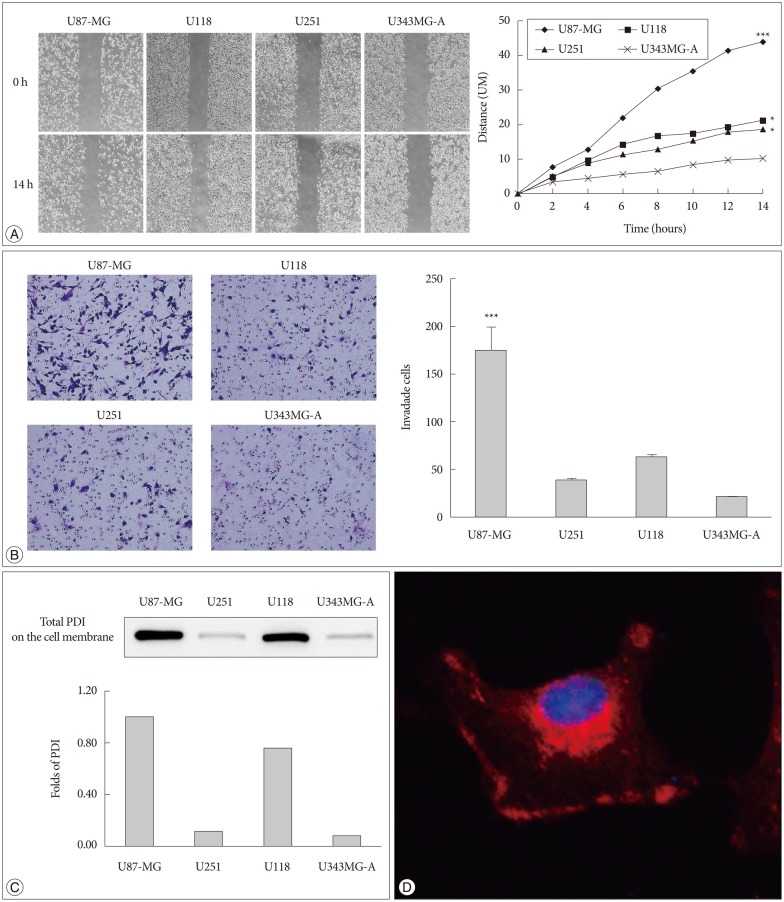
Fig. 1. PDI is related to tumor cell motility and it is localized in the cell cytosol and on the cell surface. A : The cell migration distance is measured with microscopy every 2 hours. The chart (right) shows the mobility of each cell lines (100×magnification). The distance between two sides is measured at five sites for the indicated periods of time. U87-MG, U118, and U251 have high motility, compare with U343MG-A. B : The same cell lines are used in the invasion assay, the invaded cells are counted after 24 hours (200×magnification). The experiment is performed 3 times, each data point represents the mean+SD of 4 cell lines, at the right. C : The expression of total PDI on the cell surface is shown by Western blots, and the fold difference between these four cell lines is displayed in the lower portion of the chart. D : PDI expression is observed in monolayer culture of U87-MG cells by immunofluorescence. Images are obtained by confocal laser scanning microscopy (400×magnification). *p<0.05, ***p<0.001. PDI : protein disulfide isomerase.

Fig. 1