. 2016 Feb 29;59(2):106–116. doi: 10.3340/jkns.2016.59.2.106

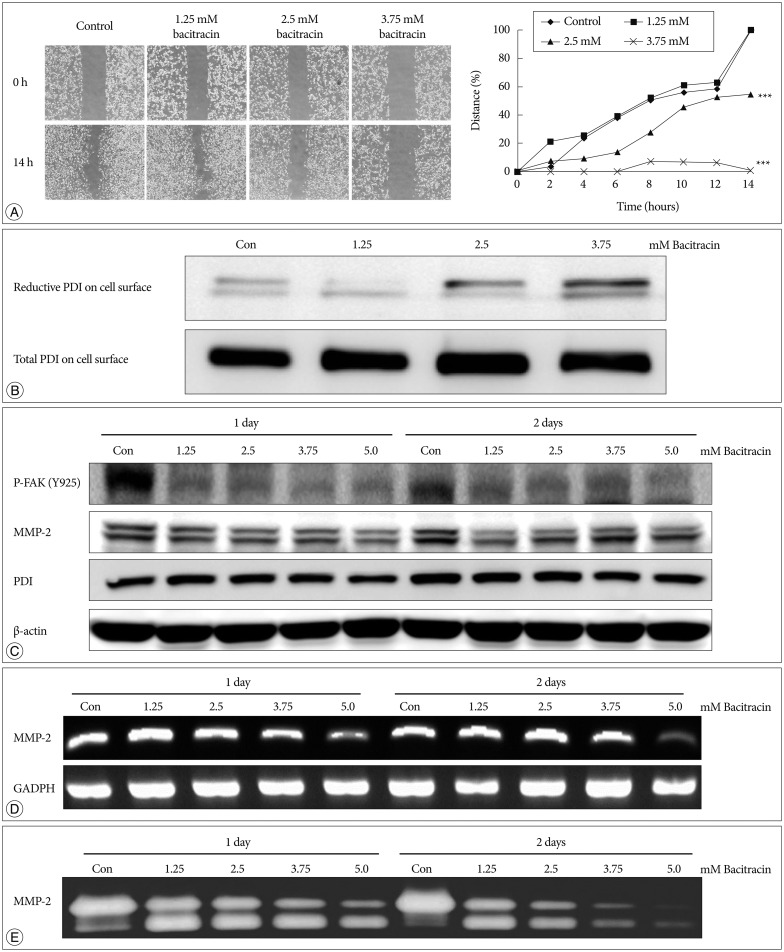
Fig. 4. Bacitracin inhibits U87-MG cell migration through affects the expression of certain molecules. A : The images show the initial and final stages of 4 groups (400×magnification). The chart show the moving tendency of U87-MG cells under different conditions. B : Western blot with labeled PDI on the cell surface shows that there is no remarkable distinction in total PDI on the cell surface; conversely, reduced PDI is increased along with an increase of the concentration of bacitracin. At the top figure the two bands indicate the members of PDI family. C : The p-FAK and MMP-2 expression decrease in the treated U87-MG cells, compare with the control group; however, the expression of PDI shows no significant difference under the same condition. In the MMP-2 image, the upper bands and the lower bands indicate latent form and activate form, respectively. D : The expression of MMP-2 is decreased with increasing of bacitracin concentration as shown by RT-PCR. E : The gelatin zymography shows that the expression of secreted MMP-2 decreases in a dose-dependent manner. The upper and lower bands also indicate the latent form and activate form, respectively. PDI : protein disulfide isomerase, p-FAK : phosphorylated focal adhesion kinase, MMP-2 : matrix metalloproteinase-2.

Fig. 4