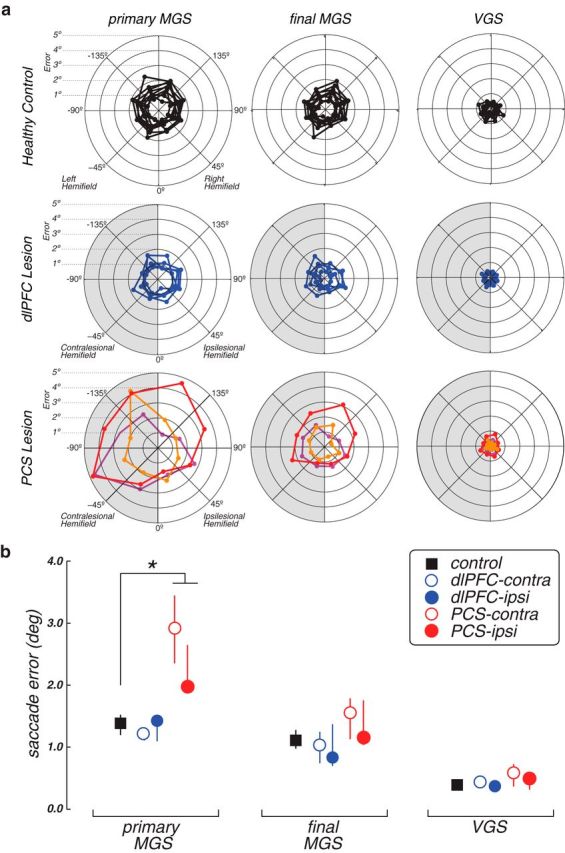
Figure 3.

Performance on WM (MGS) and control (VGS) tasks. a, Radial histograms of the accuracy of primary MGSs, the final position of the eye after corrective saccades, but before feedback, and the accuracy of visually guided saccades. Each line indicates the mean error of an individual patient or healthy control at each radial location. Shaded half represents performance in the visual field contralateral to the lesion. b, Group average error on MGS and VGS tasks. Error bars indicate SEM. Patients with PCS lesions generated primary MGSs with more spatial error than controls. *p < 0.01. The individual performance is plotted in Figure 4.
