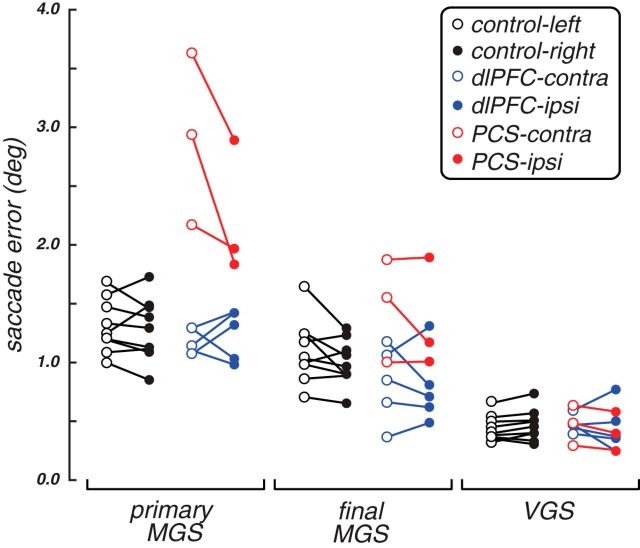
Figure 4.
Performance on WM (MGS) and control (VGS) tasks. Each dot represents the mean performance of an individual patient or healthy control, and lines connect the same participant. Open dots represent the performance in the visual field contralateral to the lesion; or in the healthy controls, it represents the left visual field. Filled dots represent the ipsilesional visual field (or right visual field in controls). The group mean performance is plotted in Figure 3.

