
Figure 1.
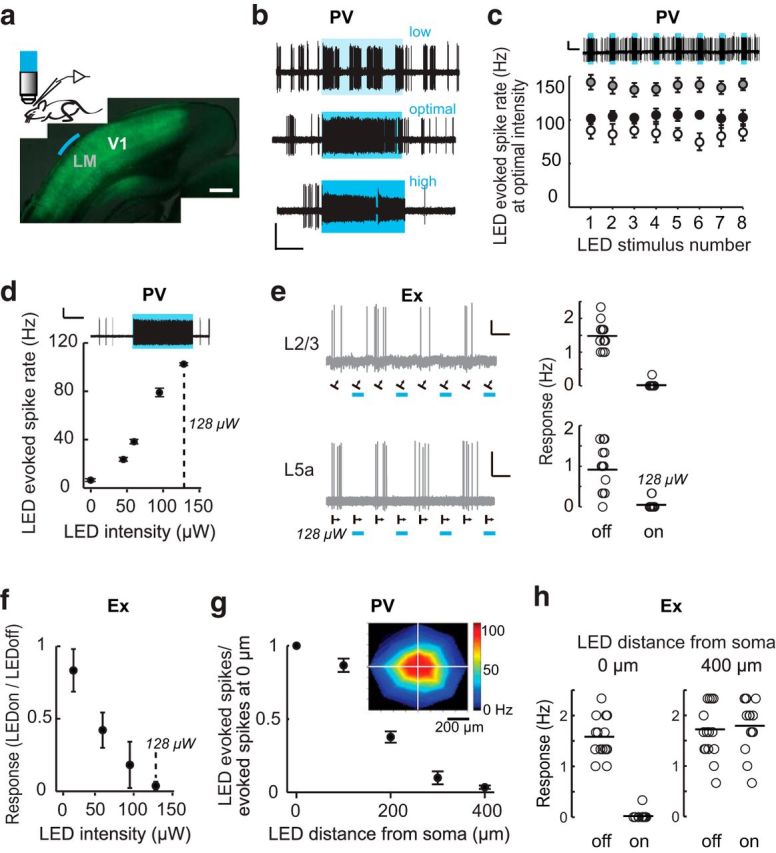
Spatially restricted optogenetic silencing of visual cortex neurons. a, Top, Schematic of recording configuration and example of a fixed coronal section of visual cortex in which PV neurons are transfected with AAV9-DiO-hChR2-eYFP (green). The area of illumination over LM is indicated in blue. Scale bar, 0.5 mm. b, Example traces depicting the selection of optimal LED intensity to stimulate PV neurons. We noted that high LED intensity could induce abnormal firing, defined by a reduction in the action potential amplitude >20% during LED stimulation. Example traces show a cell-attached recording of a L2/3 PV neuron at low (top, 7 μW), optimal (center, 25 μW), and high (bottom, 130 μW) LED intensities, LEDon trials indicated by blue boxes. The LED intensity range used in this manuscript was 22–295 μW (mean value 96 μW). Scale bar, 1 mV, 2 s. c, Reliability of LED activation of PV neurons. Top, Example trace of a cell-attached recording of a L2/3 PV neuron during 8 consecutive LED illuminations at optimal intensity lasting 3 s each, with a 9 s interval between illuminations. Scale bar, 2 mV, 6 s. Bottom, Average response of three individual PV neurons to consecutive LED stimulations. Data are mean ± SEM of three to four trials for each neuron. LED intensities used were, from top to bottom: 95, 128, and 22 μW. d, Average response of an example LM PV neuron located 250 μm below the pia surface in response to LED illumination of increasing intensity. Data are mean ± SEM of eight to 16 trials. Optimal LED intensity was determined to be 128 μW, dashed line and top trace). Scale bar, 2 mV, 3 s. e, Example traces of two LM excitatory neurons recorded in L2/3 (top left, 230 μm below the pial surface) and L5a (bottom left, 450 μm below the pial surface, from the same animal as d during visual stimulation (black arrows show the direction of the visual stimuli). The firing rate of each trial is plotted to the right. Scale bar, 2 mV, 5 s. f, Trial averages for all intensities tested for the L5A neuron shown in e, mean ± SEM of 8 trials. g, Spatial activation of the three PV neurons shown in c, mean ± SEM. The inset shows an individual neuron activation map in x, y coordinates. h, Visually evoked responses from an example excitatory neuron were silenced when the LED was positioned directly over the cell soma (0 μm) and were not affected by LED when the light was positioned 400 μm away from the soma.