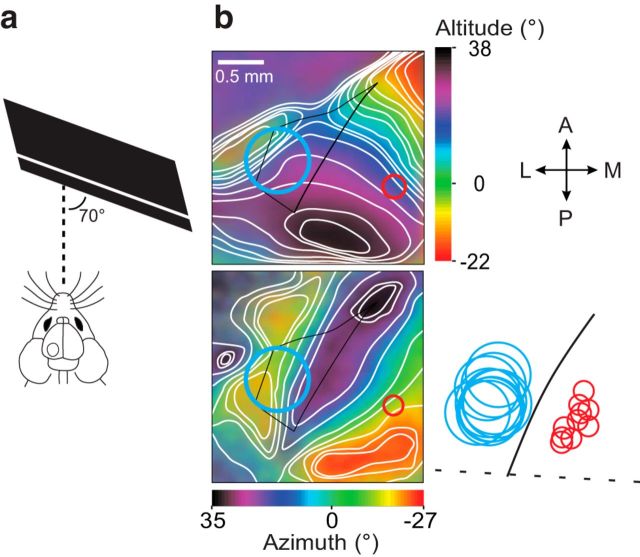
Figure 2.
Retinotopic mapping and alignment of recording and silencing sites. a, Schematic of the visual presentation during intrinsic signal imaging; the screen was positioned 25 cm from the contralateral eye at an angle of 70° to the midline. b, Retinotopic maps in response to a vertically (top left) and horizontally (bottom left) moving bar. LM borders (black) were defined by rentinotopic contours. Red and blue circles indicate V1 recording and LM silencing regions, respectively. Bottom right, Silencing and recording sites from 10 of 12 animals were projected onto an averaged coordinate space defined by the lamboid suture and V1–LM phase transition of 10 animals. The center of silencing and recording sites were located 821 ± 50 μm and 657 ± 66 μm from the lamboid suture, respectively, and separated by 896 ± 39 μm.

