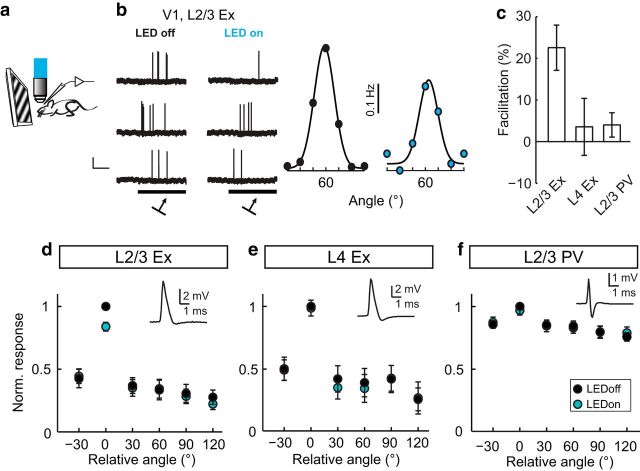
Figure 3.
Modulation of visually evoked V1 neuron responses by LM feedback is cell-type specific. a, Schematic of recording configuration. b, Example traces a V1 L2/3 excitatory neuron in response to visual stimulation (black box, arrows indicate presentation angle) in the presence (LEDon) and absence (LEDoff) of LED illumination. Scale bar, 2 mV 0.1 s. Right, Orientation tuning curves of the same neuron as in the left panel in the presence (blue) and absence of LED illumination. c, Impact of LED illumination expressed as percent facilitation of the evoked response at the preferred orientation, averaged across neurons. d–f, Average orientation tuning curves of V1 L2/3 excitatory (n = 16 neurons, 12 mice), L4 excitatory (n = 8 neurons, 6 mice), and L2/3 PV (n = 10 neurons, 5 mice) neurons aligned to their peak response. Each inset shows a representative spike waveform of the cell type recorded. Data are mean ± SEM.

