
Figure 4.
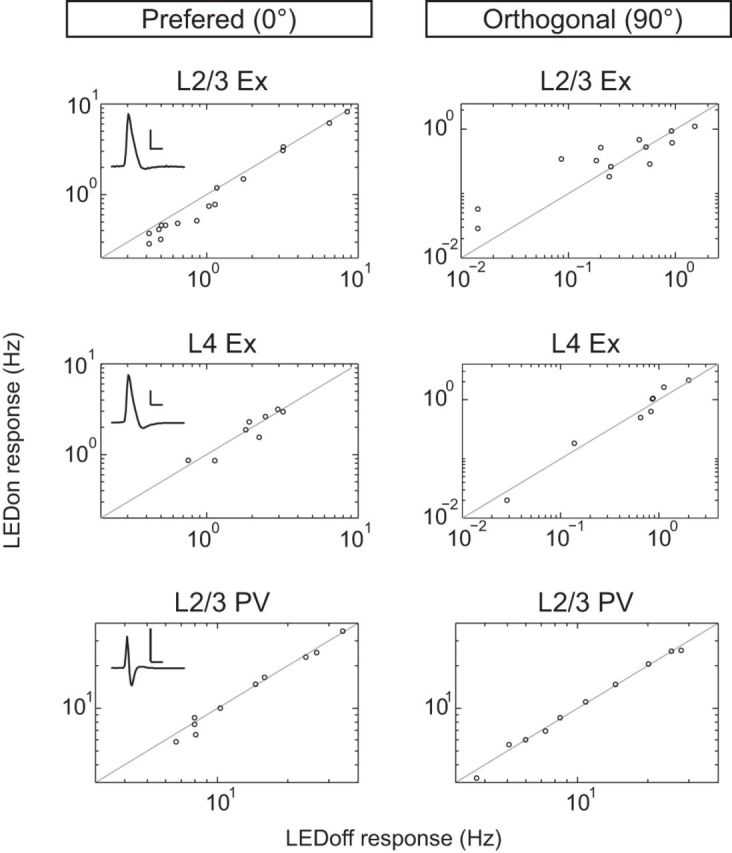
Visually evoked responses of L2/3 excitatory neurons are reduced at the preferred orientation during LM silencing. Spike rates of individual neurons in during LM silencing (LEDon) versus control trials at the preferred (0°, left) and orthogonal orientation (90°, right) are shown in relation to the unity line (black). Scale is adjusted to maximize plotting area. Each inset shows a representative spike waveform of the cell type recorded. Scale bar, 2 mV, 1 s.