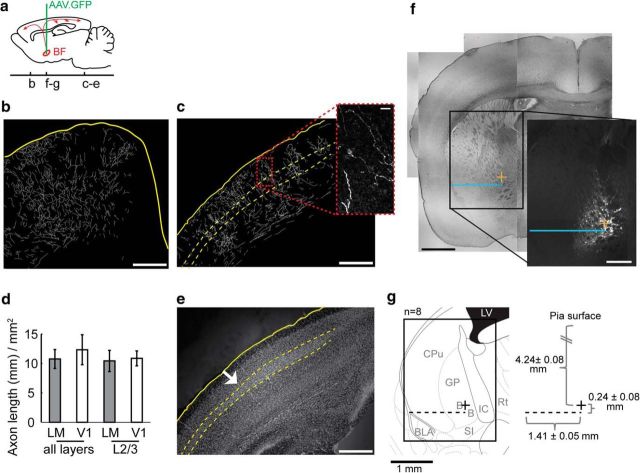
Figure 5.
Location and axonal projection pattern of the subcortical region targeted for electrical stimulation. a, Schematic of viral injection location and the rostra-caudal position of coronal slices shown in b–g, sagittal view. b, c, Traced axonal fibers projected from three imaging planes. Yellow line indicates the slice edges and the dashed line indicates the border of L4. Scale bar, 0.5 mm. Inset, Example of a single image plane of the GFP signal used for tracing. Scale bar, 200 μm. d, Quantification of axonal fibers within LM and V1 (n = 8 animals). There was not a significant difference between LM and V1 (all layers, p = 0.613; specifically L2/3, p = 0.831, paired t test). Data are mean ± SEM. e, Hoechst stain reveals the increased thickness of L4 throughout V1, same slice as c. The white arrow indicates the border between V1 and LM. f, g, Characterization of injection site location across animals. In an example slice (f), the blue line indicates the distance from the bifurcation in the white matter and the center of mass of GFP fluorescence (Fcom; yellow plus sign). White scale bar, 0.5 mm (GFP epi-fluorescence image); black scale bar, 1 mm (transmitted light image of the same slice). The medial-lateral distance of Fcom from the white matter bifurcation point was averaged across animals (g, dashed line), as well as the ventral-dorsal distance of the Fcom from the dashed line to create an x, y point (right, black plus sign) that represents the average location of the eight injections. To characterize the average target location in the eight animals examined, the x, y point was overlaid onto a scaled atlas image using the white matter bifurcation as the reference coordinate point (left). B, Nucleus basalis; BLA, basal lateral amygdala; CPu, caudate putamen; GP, globus pallidus; LV, lateral ventricle; IC, internal capsule.

