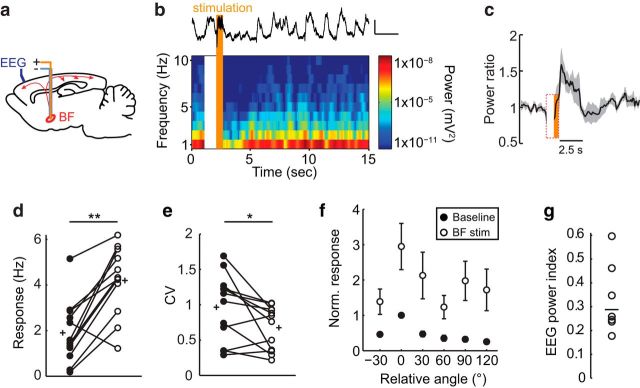
Figure 6.
BF stimulation desynchronizes cortical EEG and increases responsiveness of V1 neurons. a, Schematic of electrode placement, sagittal view. b, Representative EEG recording during BF stimulation. Top, Single stimulation trial. Bottom, Spectrogram averaged across 12 trials. Stimulation time is in orange and stimulation artifact on the spectrogram is blank. c, Time course of prefrontal EEG desynchronization induced by BF stimulation. Power ratio, EEG power at 10–100 Hz divided by EEG power at 1–10 Hz. Black line is the mean and the gray line is the SEM (n = 7 mice). d, e, V1 L2/3 excitatory neuron visually evoked responses and CV at the preferred orientation (n = 12 neurons, 7 mice) in the absence (baseline, filled circles) and presence (BF stim, open circles) of BF stimulation. Circles joined by lines indicate paired measures of individual neurons; plus signs indicate mean values. f, Average orientation tuning curves of V1 L2/3 excitatory neurons aligned to their peak response during baseline (filled circles) and BF stimulation (open circles). g, EEG power index, 1-EEG power Post-Stim1-10Hz/EEG power Pre-Stim1-10Hz, of the individual animals shown in c. *p < 0.05; **p < 0.001.

